Figure 1.
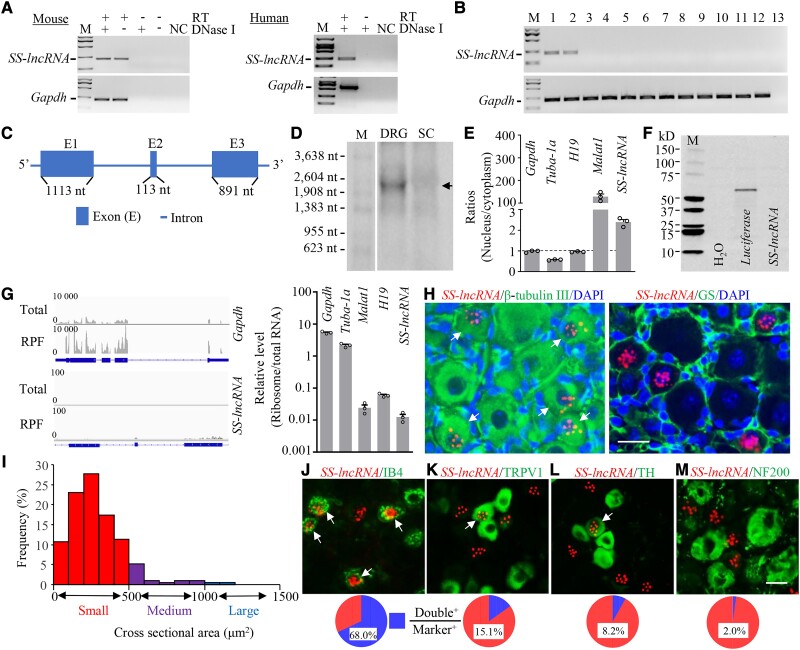
Identification and characterization of sensory neuron-specific long non-coding RNA (SS-lncRNA) in DRG. (A) SS-lncRNA transcript was detected in naïve mouse and human DRG by using reverse transcription (RT)-PCR with strand-specific primers. The extracted RNA samples were treated with excess DNase I to exclude genomic DNA contamination. Without RT primer, the PCR products of neither SS-lncRNA nor Gapdh (control) were detected in the DNase I-treated samples. n = 3 biological repeats/species. NC = H2O; M = DNA ladder marker. (B) SS-lncRNA transcript is expressed in the DRG (1) and trigeminal ganglion (2), but not in spinal cord (3), frontal cortex (4), brainstem (5), hippocampus (6), thalamus (7), cerebellum (8), lung (9), heart (10), liver (11) and kidney (12), from adult male mice. Lane 13 = H2O. Gapdh = a control; n = 3 mice. (C) Schematic diagram of full-length SS-lncRNA analysed by 5′ and 3′ RACE assay. Blue boxes and thick lines indicate exons and introns, respectively. (D) Northern blot analysis showing that SS-lncRNA (arrow) is detected in the DRG, but not in the spinal cord (SC), from naïve mice. n = 3 biological repeats (five mice/repeat). M = RNA marker. (E) Ratios of nucleus to cytoplasm for Gapdh mRNA, Tuba-1a mRNA, H19, Malat1 and SS-lncRNA in mouse DRG. n = 3 mice. (F) In vitro translation of SS-lncRNA using the transcend non-radioactive translation detection systems. Luciferase was used as a control for coding RNA. n = 3 biological repeats. (G) Ribosome profiling of SS-lncRNA and Gapdh. The blue rectangles represent exons. RFP = ribosome-protected fragments. Signal ratios of ribosome profiling to RNA sequencing (total) for mRNAs (Gapdh and Tuba-1a) and long non-coding RNAs (SS-lncRNA, H19 and Malat1). n = 3 mice. (H) Representative photomicrographs showing that SS-lncRNA (Red; signal particles ≥3) is co-expressed with β-tubulin III (green, left) in individual DRG cells (arrows) and undetected in glutamine synthetase (GS, green, right)-labelled DRG cells. 4′, 6-diamidino-2-phenylindole (DAPI, blue) is a marker of cellular nucleus. Scale bar = 25 µm. (I) Histogram showing the distribution pattern of SS-lncRNA-positive somata in normal DRG. Small, 77%; medium, 18%; large, 5%. n = 3 mice. (J–M) Co-expression of SS-lncRNA (red) with isolectin B4 (IB4, green, J), transient receptor potential vanilloid type 1 (TRPV1, green, K), tyrosine hydroxylase (TH, green, L) and neurofilament-200 (NF200, green, M) in individual DRG neurons (arrows). n = 8–10 sections from 4 to 5 mice. Scale bar = 25 µm.

