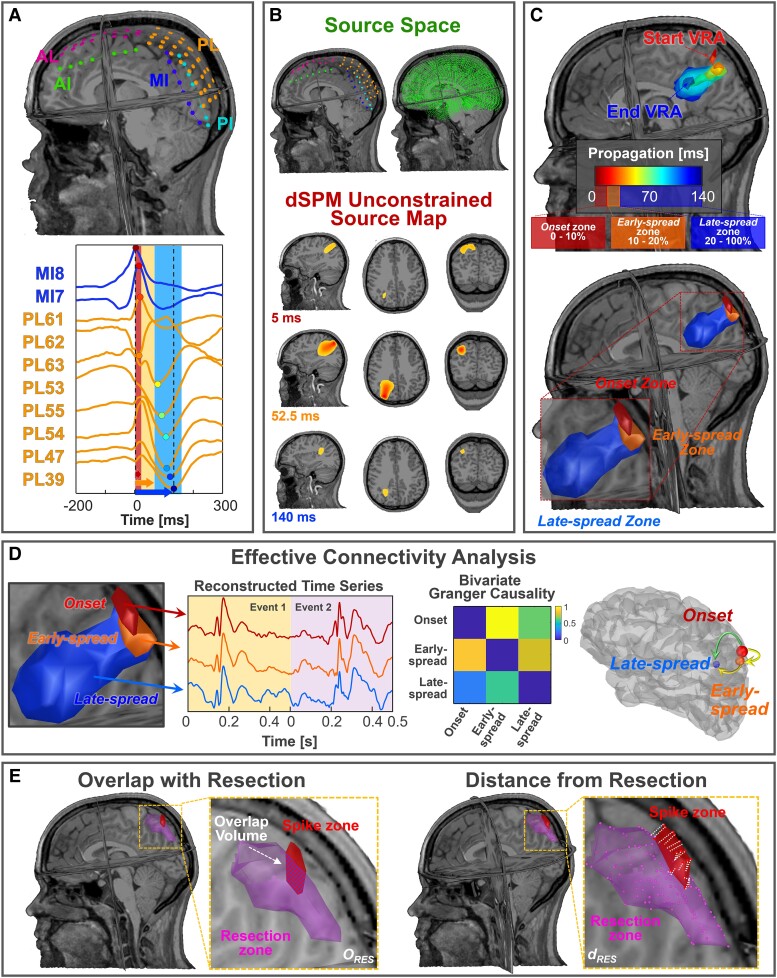
Figure 1.
Methodological pipeline (data from Patient 11). (A) Locations of intracranial EEG (iEEG) leads with respect to patient's MRI (top); spike propagation on iEEG in two iEEG leads (i.e. MI, PL) (bottom). (B) Comparison between iEEG and source space spatial resolution (top); A volumetric region of activation (VRA), decomposed in the three MRI planes, estimated through dynamic statistical parametric mapping (dSPM) at three specific time points (bottom). (C) A VRA propagation created every 5 ms by averaging the activation values (above 70%) in that window (top); onset is defined as the VRA given by the union of all the VRAs within the first 10% of the duration of propagation phenomenon, early-spread is defined as the union of the VRA in the range 10–20% of the propagation and late-spread zone is defined as the VRA given by the union of all the VRAs that occur at the remaining 80% of propagation (bottom). (D) Extraction of the three time series from onset, early-spread and late-spread zones. Computation of the Granger causality (GC) matrix between these signals and corresponding graph on the cortex highlighting the information flow direction. (E) Left: evaluation of the volume percentage of ESI zones that overlaps with resection (ORES); right: localization error definition as the mean distances of the ESI zones from resection (dRES). AI = anterior interhemispheric; AL = anterior left; MI = middle interhemispheric; PI = posterior interhemispheric; PL = posterior left.

