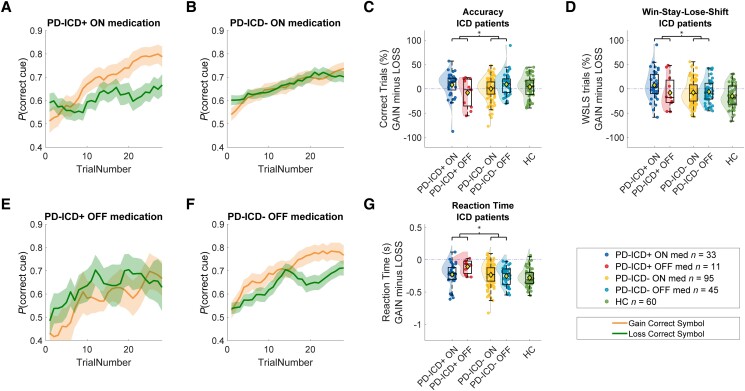
Figure 3.
Performance on the reinforcement learning task as a function of medication and impulse control disorder. Learning curves for the four different patient groups: (A) PD-ICD+ ON medication, (B) PD-ICD− ON medication, (E) PD-ICD+ OFF medication and (F) PD-ICD− OFF medication. The orange lines represent gain trials and green lines represent loss trials. Opaque areas represents the standard error of the five-trial moving mean of the accuracy of each subject. In particular, PD-ICD+ patients ON medication show reduced punishment learning. (C) Average accuracy per patient, grouped medication status and ICD class. Accuracy during loss trials was subtracted from accuracy during gain trials (for separate gain and loss figures, see Supplementary Fig. 4). (D) Win-stay-lose-shift (WSLS) behaviour per participant, grouped by medication status and ICD-class. WSLS behaviour was calculated as the percentage of stay trials after a reward minus the percentage of stay trials after a loss. (G) Reaction time difference between gain and loss trials (above zero is faster during loss trials compared to gain trials and vice versa). ICD = impulse control disorder; PD = Parkinson’s disease.

