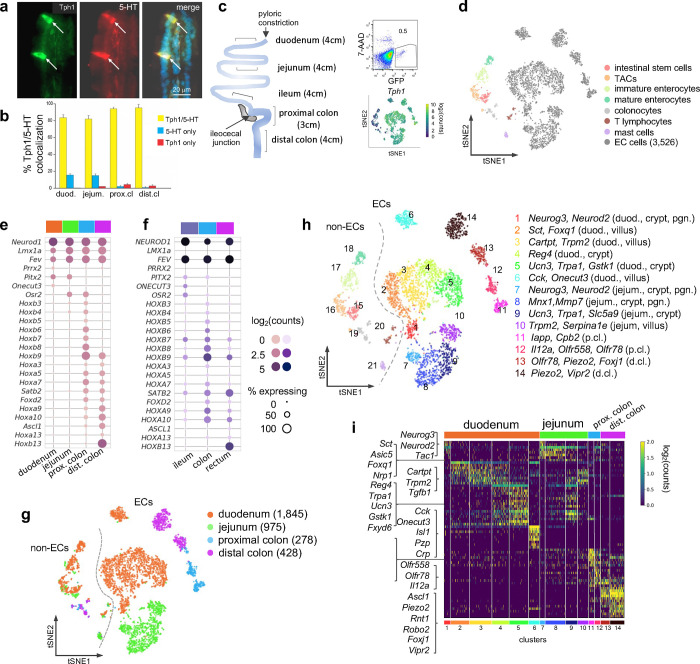
Figure 1. scRNA-seq identifies distinct intestinal enterochromaffin (EC) cell clusters.
(a,b) Dual IF staining of 5-HT and GFP (representing Tph1) (a) and their quantification/colocalization in the indicated regions of Tph1-bacTRAP mice (b).
(c) Schematic showing the isolation and enrichment of GFP+ cells from the indicated regions of the GI tract for scRNA-seq. Upper right: FACS plot of dissociated gut epithelial cells from Tph1-bacTRAP mice. Gate shows GFP+ cells, which account for ~0.5% of total viable gut epithelial cells (7-AAD− cells). Lower right: t-SNE projection of all GFP+ cells superimposed on an expression heatmap of Tph1 in GFP+ cells.
(d) t-SNE projection of all GFP+ cells isolated from Tph1-bacTRAP mice in the second cell profiling experiment, from which 3,526 enterochromaffin (EC) cells were identified and subjected to further analysis. TACs: transit amplifying cells; EC cells: enterochromaffin cells.
(e,f) Transcription factors (TFs) that are differentially expressed in the mouse EC cells isolated from Tph1-bacTRAP mice along the rostro-caudal axis presented by regions as indicated in the color bar (e). Expression data of the human orthologues of the same TFs were extracted from human gut mucosa dataset (GSE125970). Enteroendocrine (EEC) cells were selected and presented by regions (f). Size of the circles represents percentage of expression and the intensity of the circles represents aggregated expression of indicated TFs in cells partitioned by regions.
(g) t-SNE projection of all GFP+ cells color-coded by their regions in the GI tract. Numbers of cells retained from each region are indicated in parentheses. Dashed line demarcates the separation of non-EC cells (including stem cells, TACs, immature enterocytes, mature enterocytes, colonocytes, T lymphocytes and mast cells) versus EC cells.
(h) tSNE projection of all GFP+ cells color-coded by clusters that were identified via the Louvain method. 14 clusters of EC cells (clusters 1–14) and 7 clusters of non-EC cells were identified (clusters 15–21, as described in (d). Key marker genes are listed for each cluster. duod.: duodenum, jejum.: jejunum, pgn: progenitor.
(i) Heatmap of the top 5–10 signature genes for each cluster presented as normalized log2(counts) in all EC cells (in columns). Color-coded bar at the bottom represents the clusters identified in (h).

