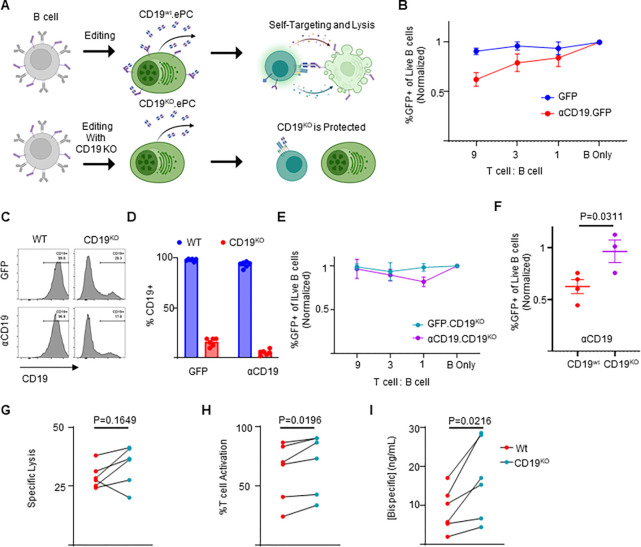
Figure 3: CD19 knockout prevents self-targeting of αCD19-ePCs and increases αCD19-bispecific secretion.
A) Schematic showing the self-targeting assay of ePCs with and without CD19 knockout. Primary human B cells were engineered to express either GFP or αCD19.T2A.GFP at the Eμ locus, and/or to eliminate CD19. These engineered cells were incubated with the indicated ratios of autologous T cells. B) After 24 hours, flow cytometry was used to calculate the percentage of GFP+ of live CD20+ B cells. The relative quantity of transgene-expressing cells was plotted. sgRNAs targeting CD19 were included to elicit knock out CD19 while engineering into the Eμ. Representative flow cytometry images C) and quantification D) of CD19 expression in engineered cells is shown. E) CD19KO cells were incubated with the indicated ratios of T cells for 24 hours. After incubation of edited cells with T cells, we used flow cytometry to quantify the % GFP+ of CD20+ cells. F) Combined data showing the GFP percentage following incubation of edited cells with T cells at a nine:one ratio. G-I) Engineered B cells were further differentiated over 3 days into ePCs. Supernatants from CD19KO and WT αCD19 ePCs were incubated with T cells, K562 CD19+ and K562 CD19− cells for 48 hours. G) Specific lysis of CD19+ K562 and H) T cell activation (%CD69+CD137+ of CD3+ cells) was quantified. I) αCD19 bispecific concentration was interpolated using recombinant αCD19 bispecific standards curves. These data are from four donors. Error bars represent SEM. P-values were calculated by paired one-way ANOVA with Dunnett’s posttest (F) and paired student’s T test (G-I). Illustrations created in part with biorender.com.

