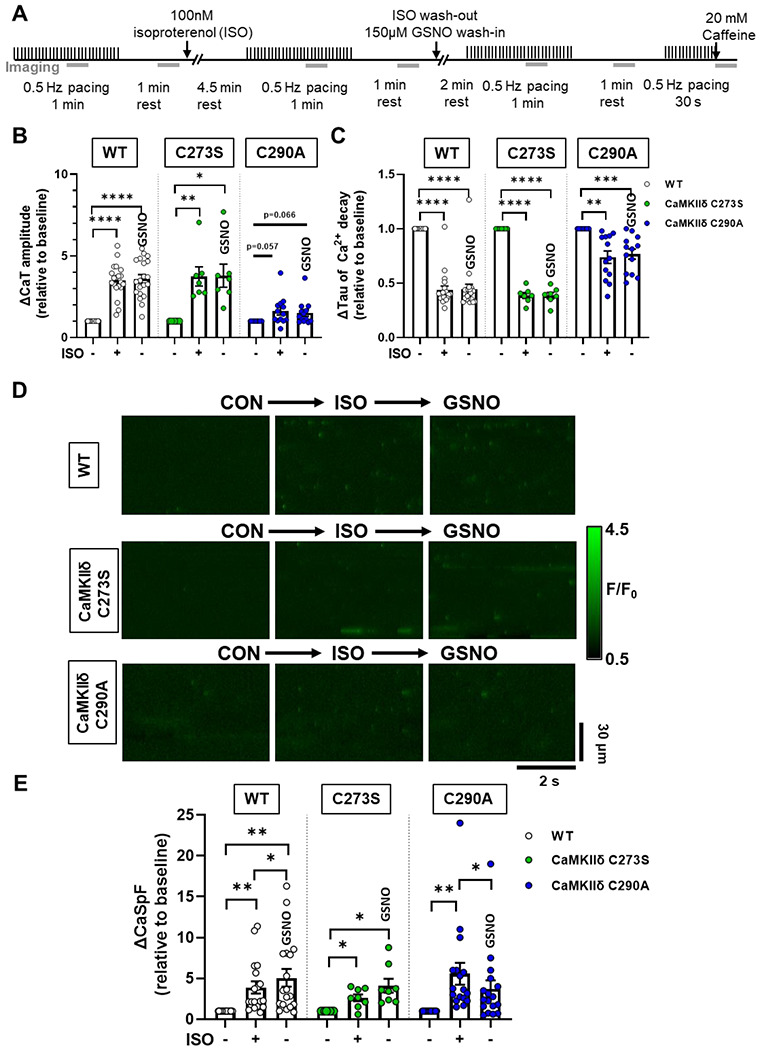
Figure 6. Effects of GSNO after ISO on Ca2+ transients and sparks in WT or CaMKIIδ-C273S and -C290A cardiomyocytes.

WT, CaMKIIδ-C273S and -C290A myocytes were stimulated at 0.5 Hz and exposed to 100 nM ISO, then following ISO exposure myocytes were exposed to 150 μM GSNO. Experimental protocol used for Ca2+ imaging, the grey bars represent when line-scan images were acquired (A). Mean Ca2+ transient amplitude (B) and decay (C) data are shown for cardiomyocytes in response to ISO and wash-out with GSNO (WT: n=20 cells, N=9 hearts; CaMKIIδ C273S: n=7 cells, N=5 hearts; CaMKIIδ-C290A: n=13 cells, N=5 hearts). Representative line-scans from quiescent WT, CaMKIIδ-C273S and -C290A cardiomyocytes under indicated conditions (D). Mean Ca2+ spark frequency data (E) are shown for cardiomyocytes in response to ISO with washout with GSNO (WT: n=18 cells, N=9 hearts; CaMKIIδ C273S: n=8 cells, N=5 hearts; CaMKIIδ-C290A: n=17 cells, N=5 hearts). All data are normalized to baseline control before addition of ISO.
