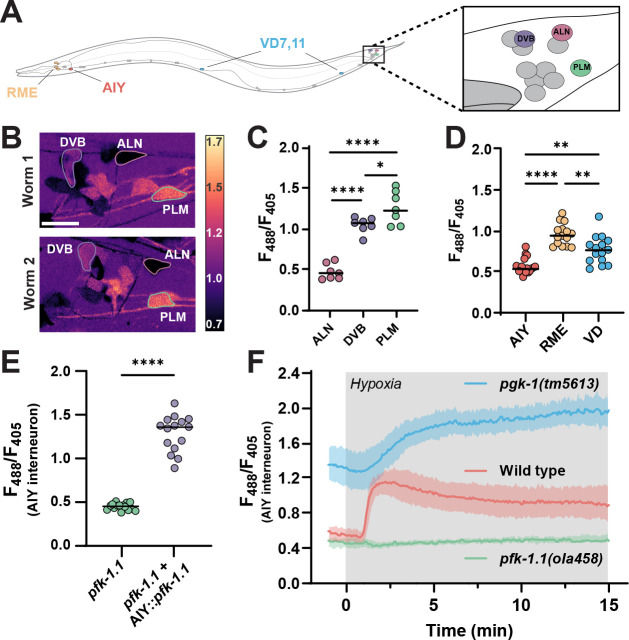
Figure 2: Glycolytic profiles map onto neuronal identities in vivo.
(A) Schematic of C. elegans with positions of individual, identifiable neurons characterized in this study labeled, including tail ganglia (highlighted with box on the right) corresponding to images in (B). VD neurons were quantified using VD7 and VD11. (B) Pan-neuronally expressed HYlight, showing 488/405 nm ratio of excitation for neurons in the tail ganglia of two representative worms (Worm 1, top; Worm 2, bottom) under normoxic conditions, with identifiable neurons (DVB, ALN and PLM) labeled. Scale bar, 10 μm. (C) As (B), but quantified for seven individual worms. Significance values of * or **** represent P-values of 0.0299 or <0.0001, respectively, as calculated by ANOVA with Tukey post-hoc test. (D) Cell-specific promoters were used to express HYlight in either AIY (ttx-3p), or RME and VD neurons (unc-47p), with ratios quantified under normoxic conditions in 15 animals. Significance values are 0.0012 (AIY vs VD), <0.0001 (AIY vs RME), and 0.0018 (RME vs VD) via ANOVA with Tukey post-hoc test. (E) HYlight examined in AIY interneurons of pfk-1.1(ola458) mutant animals, or with cell-specific expression of wild-type PFK in AIY in this same mutant. Significance values indicate P-values of <0.0001 (****) as calculated by unpaired t-test for 15 animals. (F) HYlight responses in varying genetic backgrounds under transient hypoxia. There is an increase in glycolysis in wild-type worms within 2 minutes of hypoxia treatment (see also Movie S2). pfk-1.1(ola458) mutant animals start at lowered levels of HYlight signal (as compared to wild type) and fail to increase upon hypoxia. The loss-of-function mutation pgk-1(tm5613), an enzyme downstream in the glycolytic pathway (Figure S2), starts at an elevated level of FBP and increases further upon transient hypoxia. Shading represents the standard deviation around mean values for 15 worms per treatment. Hypoxia treatment represented by grey box.

