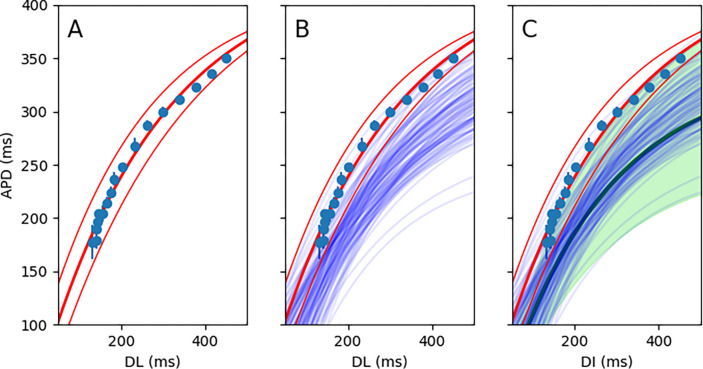
Figure 2. The schematic of composite restitution curve generation.
An exponential curve fits a set of (DI, APD) data points for one pixel. The 95% confidence-interval curves are also shown (A). The restitution curves for all the pixels in a region of interest (say, with period-2 on the local analysis) are calculated (only 100 curves are shown here)(B). Monte Carlo sampling is performed to generate a composite restitution curve (the thick green line) and the confidence interval (shown in a green shade)(C).

