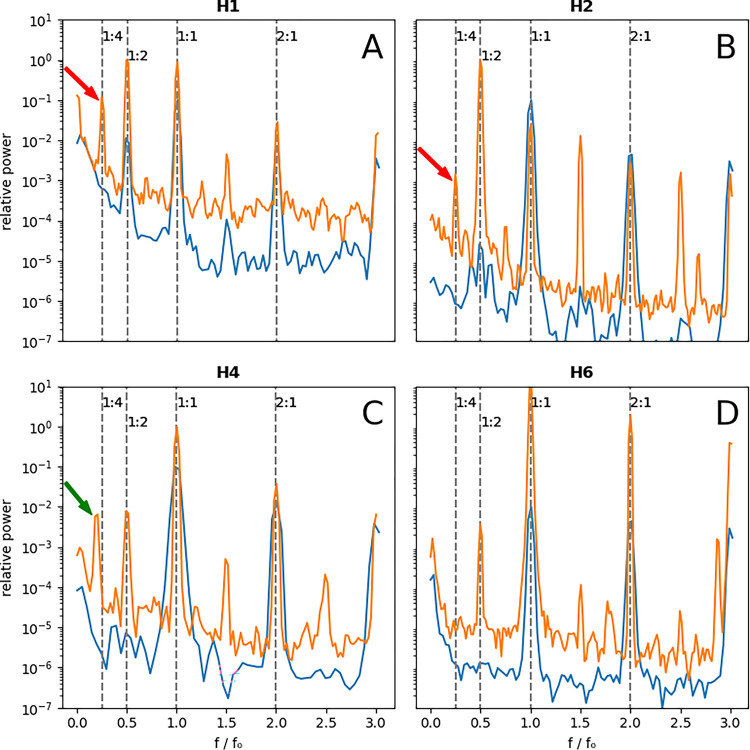
Figure 3. Comparison of baseline and pre-VF spectrograms using global analysis.
The blue spectrograms are the baseline (stimulation cycle length of 500 ms except for H4 at 800 ms) and the orange spectrograms are obtained just before VF induction. H1, H2 (A and B) exhibit prominent 1:4 peaks (the red arrows), while no discernable 1:4 peak is seen for H6 (D). H4 has a ~0.18 peak (the green arrow), corresponding to mainly period-6 activity (C). The baseline signals are multiplied by 0.1 to offset the signals for better visualization.

