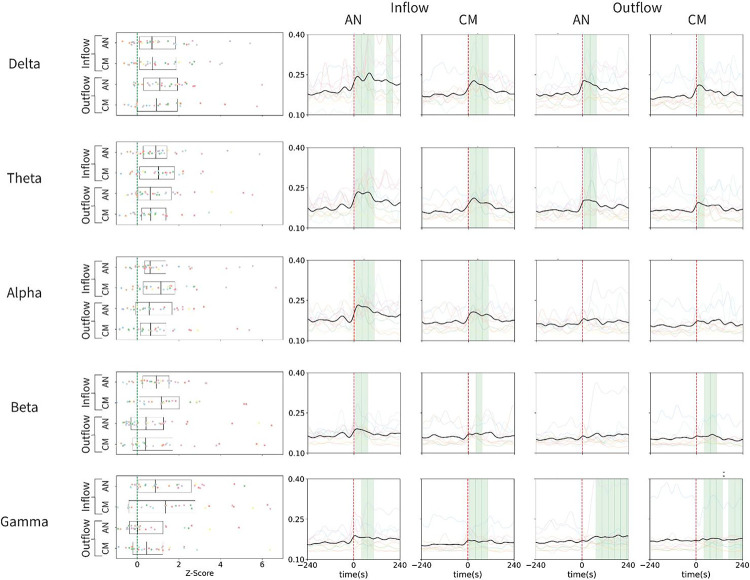
Figure 3. Summary of Granger causality analysis across seizures.
The left panels illustrate the z-scored change in spectral Granger causality from the baseline period (20–10 mins before seizure) to the seizure window (0–10s after seizure), while the right panels depict the group analysis of the time course of spectral Granger causality from 4 minutes before seizure to 4 minutes after seizure for different electrode interactions. Inflow refers to the directed spectral Granger causality from the onset to AN or CM, while outflow refers to the directed causality from AN or CM to the onset. The shaded green regions indicate if a window exhibits a statistically significant increase in spectral Granger causality. The differently colored lines represent the mean values of all seizures for a specific patient, and the bolded black line represents the mean across all seizures. Overall, there is a clear and significant increase in bidirectional spectral Granger causality between the thalamus and cortical onset in the Delta, Theta, Beta, and Gamma frequency bands. In the Alpha band, there are only statistically significant increases in the inflow to the thalamus.
AN: anterior nucleus; CM: centromedian

