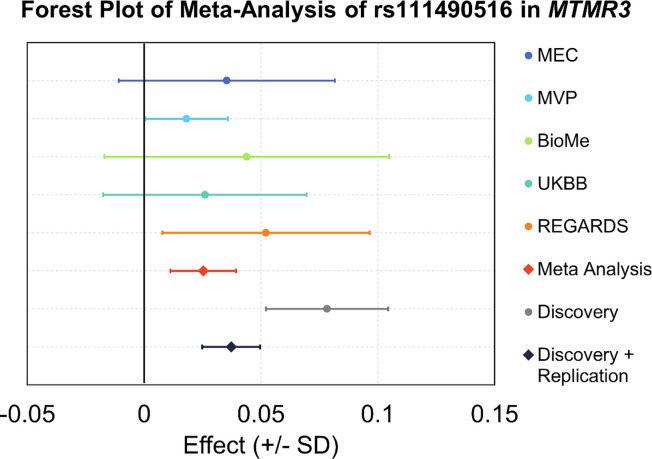
Figure 3. Forest plot of rs111490516 replication.
All effect estimates (95% confidence interval) are oriented on the BMI increasing allele and are provided as standard deviation per allele. Actual beta values and P-values are in Supplementary Data 7.

