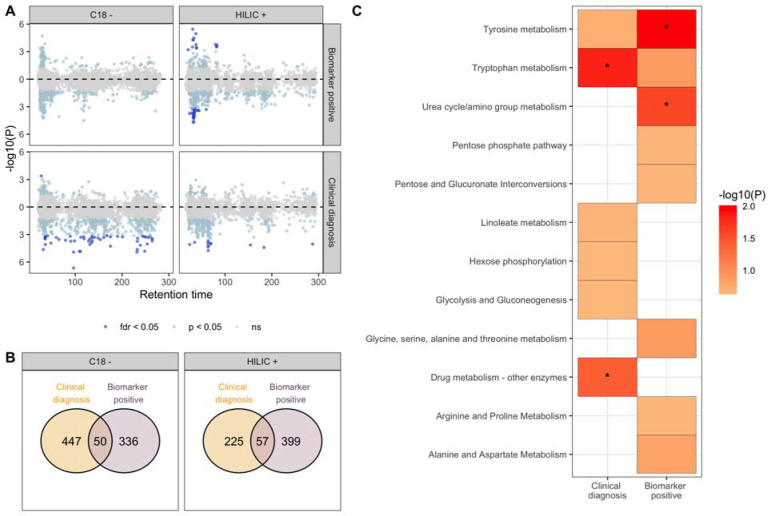
Figure 1. Metabolic features and pathways associated with clinical AD and with biomarker positive status.
In A, a modified Miami plot shows features with positive beta values above the zero line and those with negative beta values below the zero line. The dark blue points indicate features with FDR q-value < 0.05 for data obtained for each column (C18 and HILIC). In B, the overlap in features associated with clinical AD and biomarker positive status at nominal p < 0.05 (light blue and dark blue points) for each column. In C, the metabolic pathways, with Fisher’s exact test p < 0.3, enriched by features nominally associated with the clinical AD and biomarker positive status. An asterisk indicates pathway that were significantly enriched (p < 0.05).

