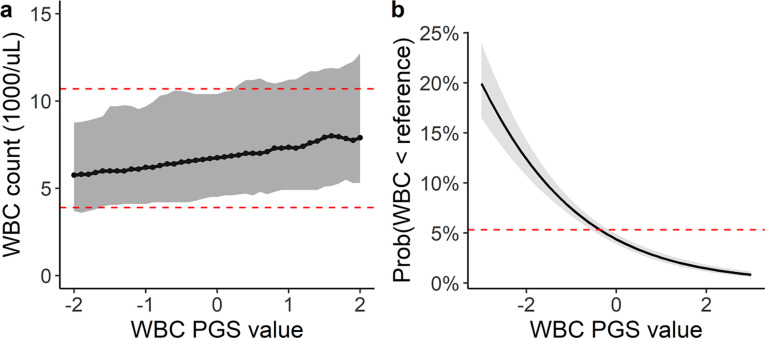
Figure 2: PGS associations with measured WBC counts among 11,694 BioVU participants.
(a) Ranges of observed WBC counts by PGSWBC value. Ranges summarize WBC counts within sequential windows (+/− 0.2 s.d.) across the range of the PGSWBC. The dark line is the median value and the grey ribbon represents the 5th to 95th percentiles of the range. The dashed red lines denote the upper and lower clinical reference ranges for the clinical assay used to measure the WBC count. (b) Predicted probability of having a WBC count that falls below the lower clinical reference value across range of PGSWBC values. Probabilities are based on a logistic regression model adjusted for age and sex. The dashed red line is the average probability for the entire population.

