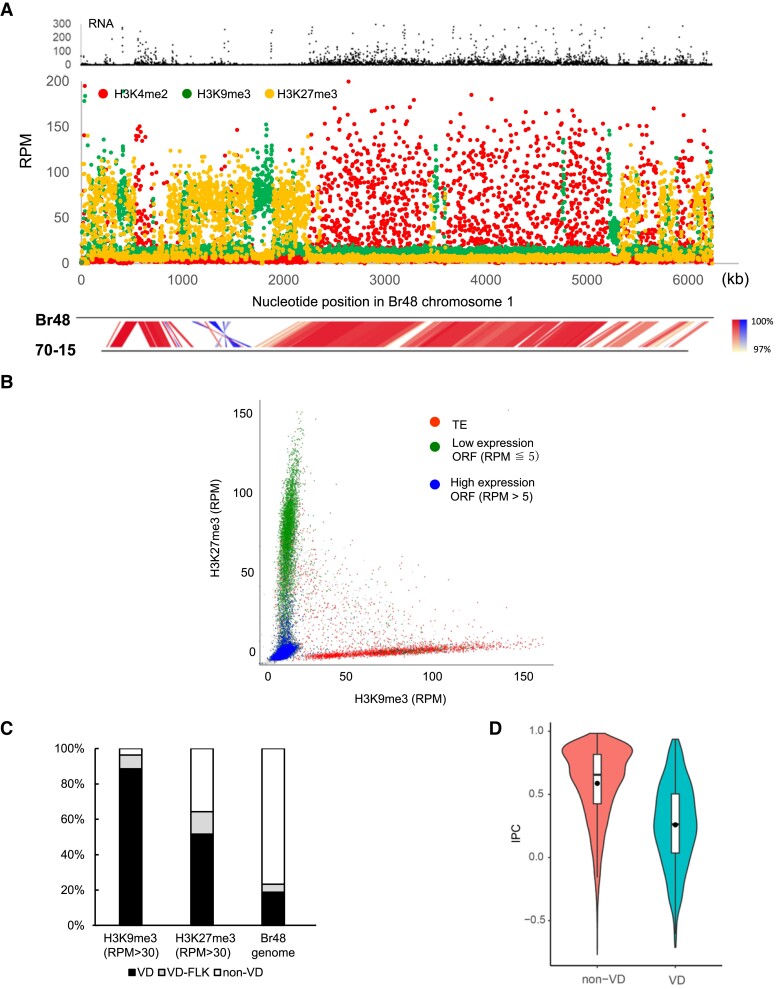
Fig. 5.
Silent epigenetic marks are tightly associated with variable domains (VDs) in the Br48 genome. (A) Read mapping data of RNA-seq and ChIP-seq analysis on chromosome 1 of Br48. RNA used in the analysis was extracted from vegetative mycelia. Reads mapped to TE sequences (supplementary table S2, Supplementary Material online) were collected and then mapped to the Br48 genome. Each dot indicates an RPM value of a 1 kb segment in the Br48 genome (see the text). (B) Relationship between H3K9me3 and H3K27me3 levels at 1 kb resolution. RPM values of H3K9me3 (X-axis) and H3K27me3 (Y-axis) in a 1 kb segment were plotted as gray dots. Red dots indicate TE-containing 1 kb segments (more than 50% of the sequence is covered by TE reads). Green dots show silent open reading frame (ORF)-containing 1 kb segments (RNA RPM is less than 5, and more than 50% of the sequence corresponds to exons). Blue dots indicate active ORF-containing 1 kb segments (RNA RPM is larger than 5, and more than 50% of the sequence corresponds to exons). (C) Proportions of H3K9me3-rich (RPM >30) and H3K27me3-rich (RPM >30) segments in the three genome domains, VD, 3 kb sequences adjacent to VDs (VD-FLK), and non-VDs (see details in the text). (D) Violin plots of IPC values in VDs and non-VDs. The horizontal line and closed circle in the boxplot represent the median and the average, respectively.

