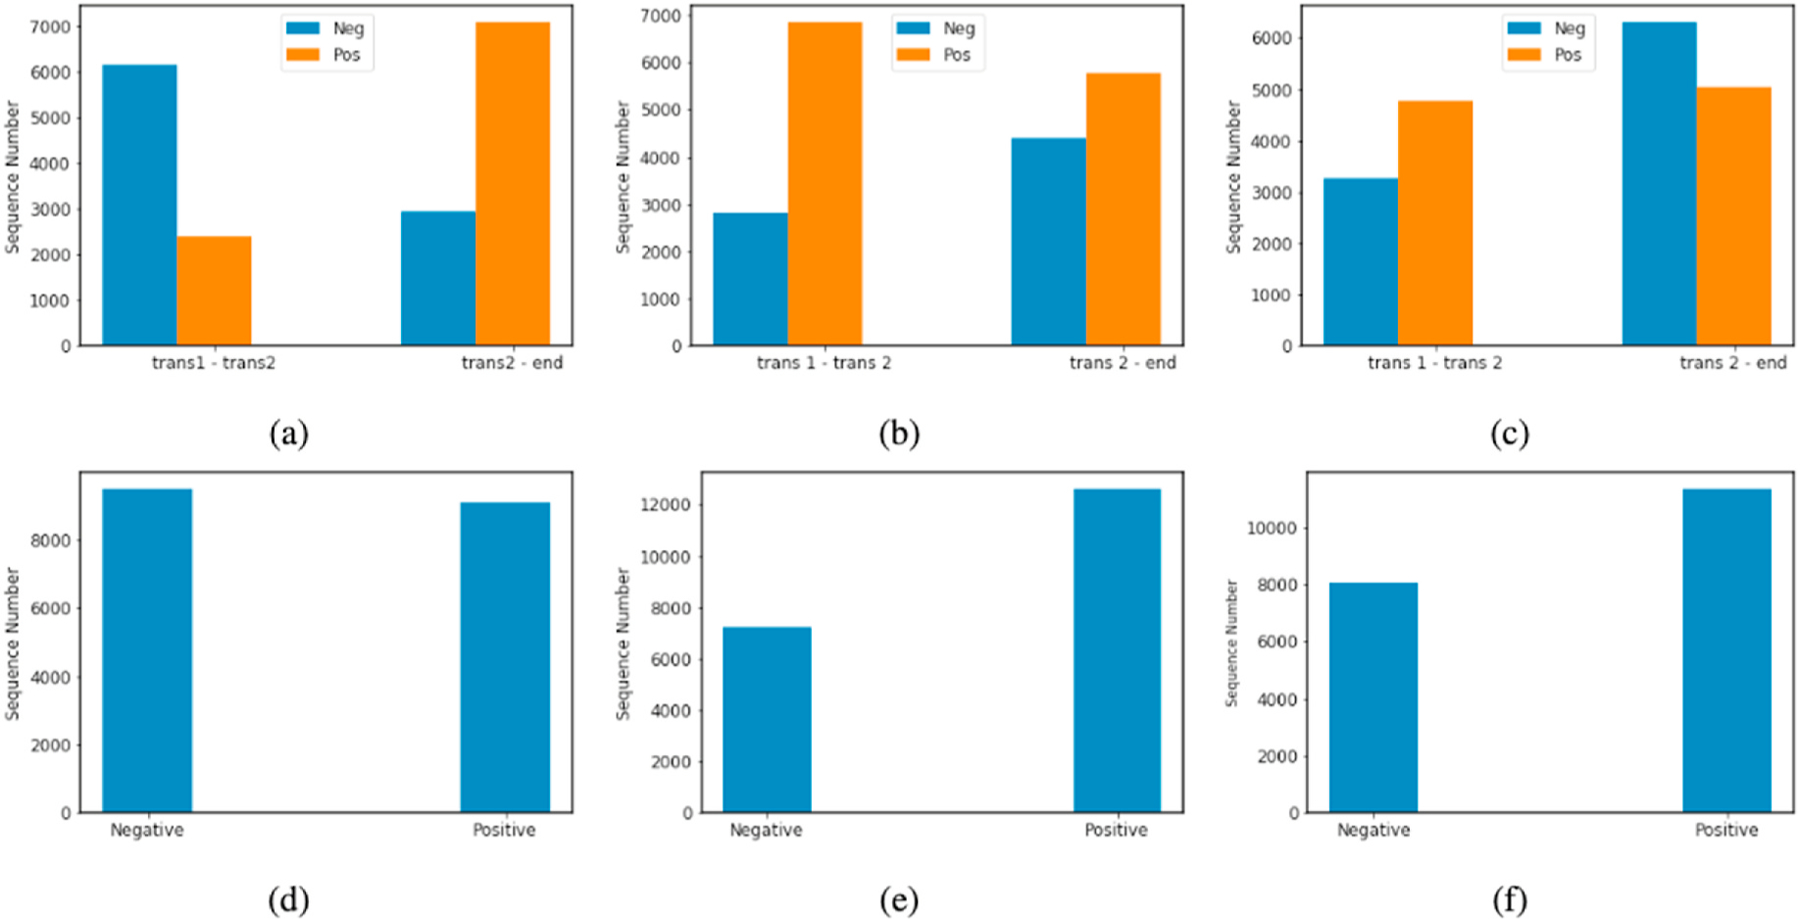
Fig. 2. Distribution of HRQOL trajectories.

The distributions before combination of two trajectories for each outcome measurement are shown for (a) PCS, (b) MCS, and (c) average THYCA. The distributions after combining the trajectories are shown for (d) PCS, (e) MCS, and (f) Average THYCA.
