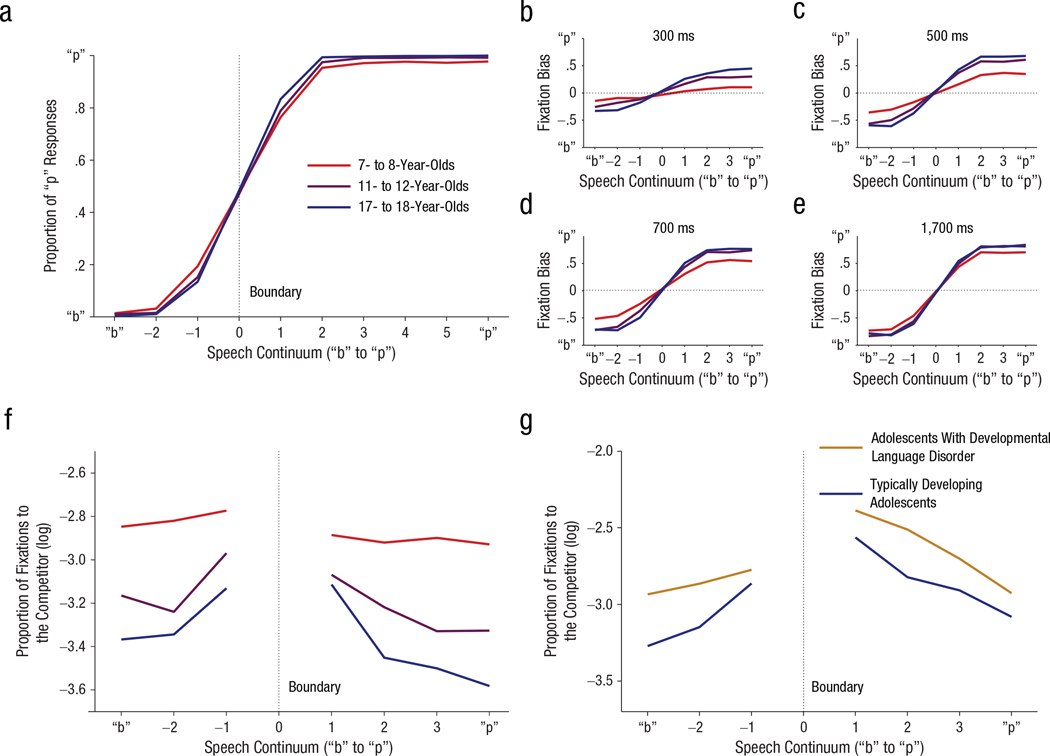
Fig. 3.
The development of speech categorization. The graph in (a) shows the proportion of “p” responses (mouse clicks on the picture showing something referred to by a word beginning with “p”) as a function of voice-onset time (VOT) step in typically developing 7- to 8-year-olds, 11- to 12-year-olds, and 17- to 18-year-olds. VOT is expressed relative to each participant’s own boundary, such that 0 is the participant’s boundary, −1 is one step to the left, and so forth. The graphs in (b) through (e) show fixation bias at four different time points (300 ms, 500 ms, 700 ms, and 1,700 ms) for the same three age groups. Fixation bias was computed from the relative proportions of looking to objects beginning with “b” versus objects beginning with “p.” A score of −1 indicates full commitment to “b” (all fixations were on the “b” object), whereas a bias of +1 indicates complete commitment to “p.” The graphs in (f) and (g) show the proportion of looks to the competitor as a function of distance from the category boundary, for trials in which the child chose the “correct” phoneme; results for typically developing children are shown in (f), and results for adolescents with and without developmental language disorder are shown in (g). Data for (a) through (f) are from McMurray et al. (2018), and data for (g) are from McMurray et al. (2014).

