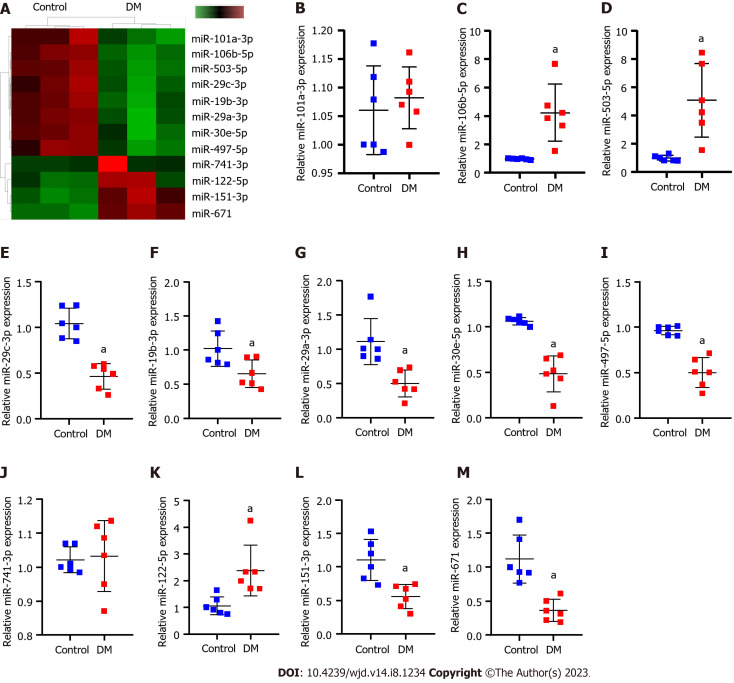
Figure 1.
Differentially expressed miRNAs that affect diabetic nephropathy progression. A: High-throughput sequencing analysis of the differences between the diabetes mellitus rats and normal rats concerning expressed miRNAs. In the heatmap, green squares indicate low expression and red squares indicate high expression; B-M: Real-time quantitative polymerase chain reaction verification of differentially expressed miR-151-3p, miR-19b-3p (B), miR-106b-5p (C), miR-30e-5p (D), miR-122-5p (E), miR-29a-3p (F), miR-29c-3p (G), miR-497-5p (H), miR-101a-3p (I), miR-741-3p (J), miR-503 (K), miR-671 (L), obtained by high-throughput sequencing (M). aP < 0.05 vs the control group. DM: Diabetes mellitus; miR: microRNA; RT-qPCR: Real-time quantitative polymerase chain reaction.

