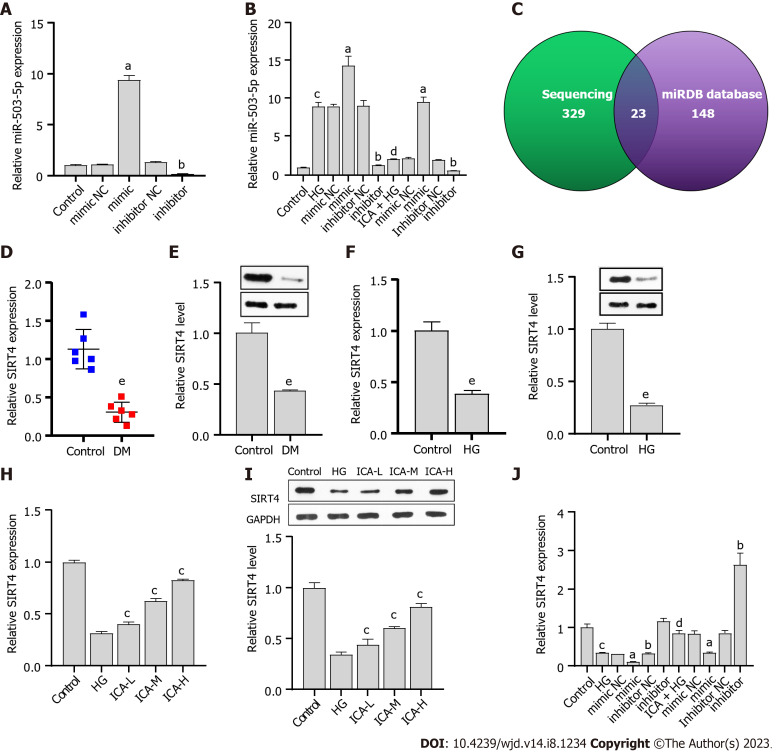
Figure 3.
miR-503 negatively regulates sirtuin 4. A: Real-time quantitative polymerase chain reaction (RT-qPCR) verification of the effectiveness of miR-503 mimic/inhibitor; B: RT-qPCR analysis of the effect of Icariin (ICA) treatment on high glucose (HG)-induced miR-503 expression; C: High-throughput sequencing results combined with the miRDB database to screen for the putative target gene of miR-503; D: RT-qPCR analysis of sirtuin 4 (SIRT4) expression in normal and diabetic nephropathy (DN) rat kidney tissue; E: Western blot analysis of SIRT4 protein level in normal and DN rat kidney tissue; F: RT-qPCR analysis of the effect of HG on SIRT4 expression; G: Western blot analysis of the effect of HG on SIRT4 protein level; H: RT-qPCR analysis of the effects of low, medium, and high doses of ICA in the treatment of HG-induced SIRT4 expression; I: Western blot analysis of the effects of low, medium, and high doses of ICA in the treatment of HG-induced SIRT4 protein level; J: RT-qPCR analysis of the effect of ICA treatment on HG-induced SIRT4 expression. aP < 0.05 vs the mimic negative control (NC) group; bP < 0.05 vs the inhibitor NC group; cP < 0.05 vs the control group; dP < 0.05 vs the HG group; eP < 0.05 vs the control group. DN: Diabetic nephropathy; HG: High glucose; miR: microRNA; NC: Negative control; RT-qPCR: Real-time quantitative polymerase chain reaction; ICA: Icariin; L: Low; M: Medium; H: High; SIRT4: Sirtuin 4.

