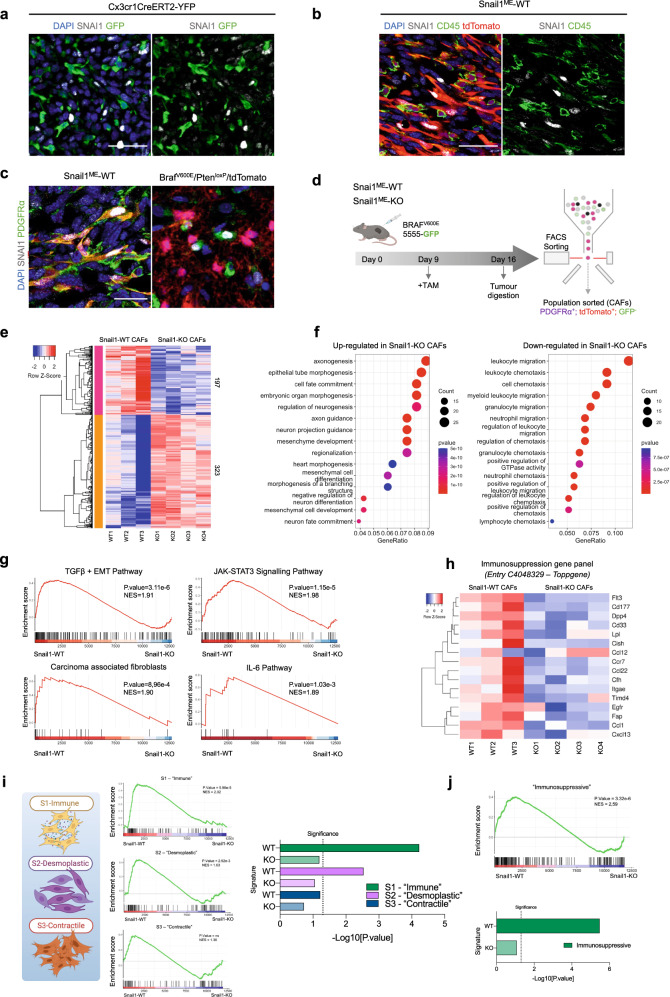
Fig. 2. Snail1 expression in PDGFRα+-CAFs is associated with fibroblast activation and immunosuppression signatures.
a Representative images of immunolabelling for SNAI1 (white) and myeloid cells (green) in a section of a BrafV600E-5555 melanoma grown in Cxcr1CreERT2-YFP mice. b Representative images of immunolabelling for SNAI1 (white) and CD45 (green) in melanomas from Snail1ME-WT mice. Stromal cells are labelled in red (tdTomato). c Representative images of immunolabelling for SNAI1 (white) and PDGFRα (green) in BrafV600E-5555 tumours from Snail1ME-WT mice. Stromal cells are labelled in red (tdTomato) (left panel) and in BRAFV600E/PtenloxP/tdTomato melanomas where melanoma cells are labelled in red (tdTomato) (right panel). Scale bar: 25 µm. d Schematic illustration of the strategy followed to isolate fibroblasts from BrafV600E-5555 melanomas in Snail1ME-WT and Snail1ME-KO mice. Created with BioRender.com. e RNAseq heatmap of differentially expressed genes (DEGs). The scale bar corresponds to row Z score in a -2–2 relationship. Filtered and normalised count per million data from the DEGs has been plotted to compare Snail1-WT and Snail1-KO CAFs. Columns represent the different samples. Each sample is a pool of three different animals with the same genotype WT n = 3, KO n = 4. f Representation of gene ontology enrichment analysis of the 15 top GO terms as ranked by various gene set testing methods. The dot plot size and colour represent the relative number and relevance of the genes in the set, respectively. g Gene set enrichment analysis (GSEA) of DEGs genes (log2 ratio-ranked) shows enrichment of TGFβ + EMT, JAK-STAT3 and IL-6 pathway signatures and enrichment of Carcinoma-associated fibroblasts signature in Snail1-WT CAFs. NES (normalised enrichment score) and p-value scores are shown. h Panel showing expression of genes associated with immunosuppression from entry C4048329 in the Toppgene and DisGeNet databases. i GSEA analysis of custom gene sets generated from DEGs in the S1 “immune”, S2 “desmoplastic” and S3 “contractile” CAFs populations defined in [42]. NES (normalised enrichment score) and p value scores are shown, ns, not significant. Created with BioRender.com. j GSEA analysis of marker gene sets in the immunosuppressive breast CAF population defined in [43]. NES (normalised enrichment score) and p value scores are shown.

