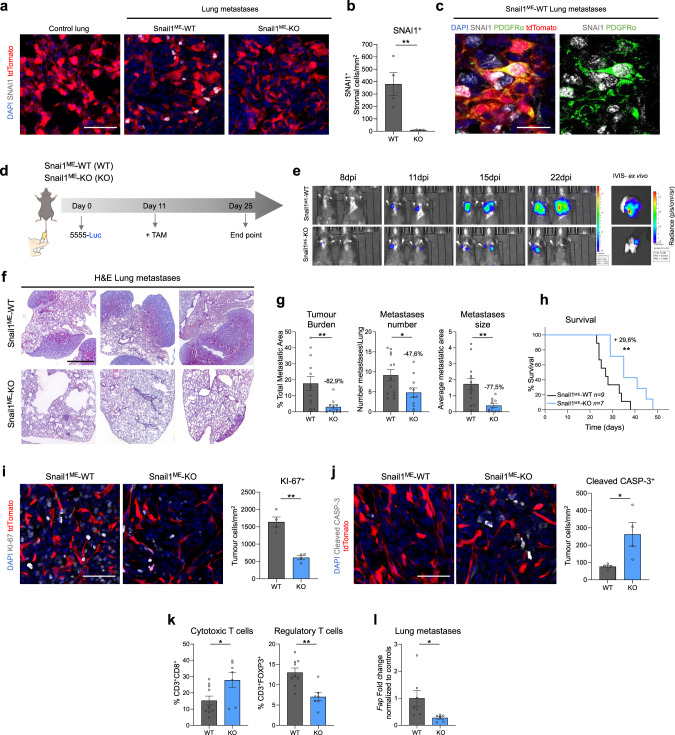
Fig. 5. Microenvironmental Snail1 depletion reduces melanoma metastatic burden and improves mice survival.
a Representative images of immunolabelling for SNAI1 in control lung tissue and BrafV600E-5555 lung metastases from Snail1ME-WT and Snail1ME-KO mice. Scale bar: 50 µm. b SNAI1 quantification after TAM administration in lung metastases from (a). c Representative images of double immunolabelling of SNAI1 (white) and PDGFRα (green) in BrafV600E-5555 lung metastases from Snail1ME-WT. Scale bar: 25 µm. d Experimental set-up of the in vivo strategy design to study the contribution of Snail1 to lung metastases progression in Snail1ME-WT (WT) and Snail1ME-KO (KO) mice. Created with BioRender.com. e Bioluminescent signal in mice from (d). The BLI scale is represented next to each panel. Units: p/s/cm2/sr (n = 13 WT and n = 11 KO). f Representative H&E-stained lung sections 25 days post-injection. Scale bar: 2 mm. g Tumour burden, number of metastases and metastases size, quantified in lungs from (d) (n = 13 WT and n = 11 KO). h Overall survival of Snail1ME-WT and Snail1ME-KO mice with melanoma lung metastases after Snail1-silencing compared to controls (n = 9 WT and n = 7 KO). i Representative images of immunolabelling for KI-67 and quantification (n = 4 per condition) in melanoma lung metastases from (d). Scale bar: 50 µm. j Representative images of immunolabelling for Cleaved-CASP3 and quantification (n = 4 per condition) in lung metastases from (d). Scale bar: 50 µm. k Graphs showing percentages of Cytotoxic T cells (CD3+CD8a+) and Regulatory T cells (CD3+FOXP3+) in lungs from (d) (n = 10 WT and n = 7 KO) assessed by flow cytometry. l Fap mRNA levels assessed by RT-qPCR in Snail1ME-WT (WT) and Snail1ME-KO (KO) lung metastases. Data are represented by Mean ± SEM and statistically significant differences are tested by unpaired two-tailed Student t-test. Each dot represents one animal (*=p < 0.05 and **=p < 0.01).

