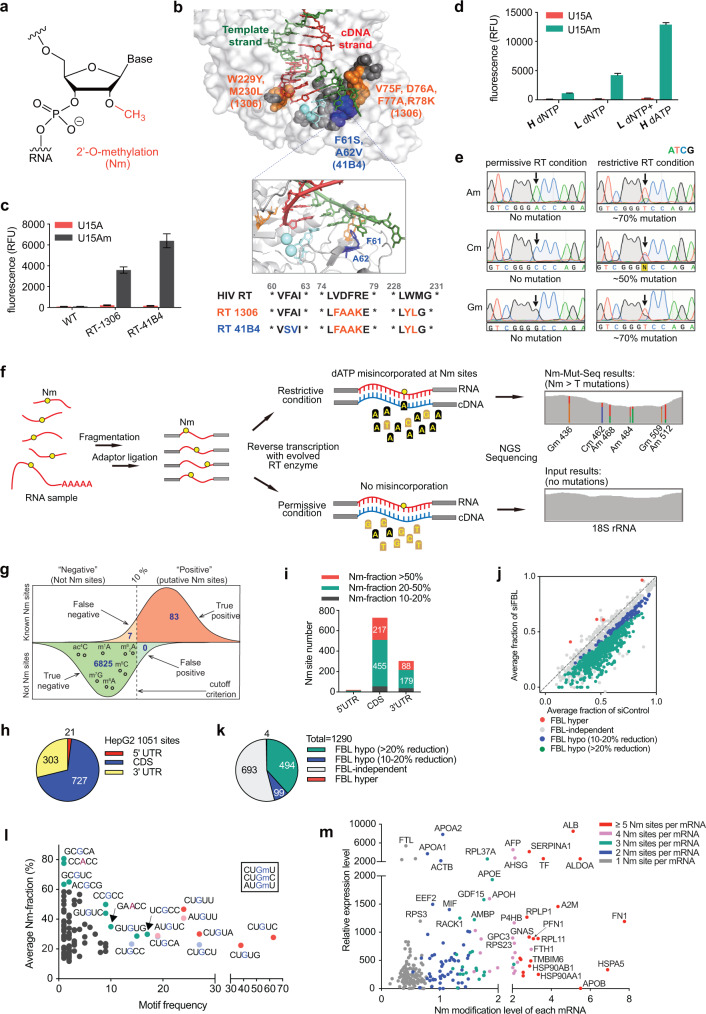
Fig. 1. Base-resolution quantitative mapping of transcriptome-wide 2′-O-methylation using Nm-Mut-seq.
a Chemical structure of 2′-O-methylation (Nm). b Top, the space-filling model of HIV-1 RT structure (PDB ID: 1RTD) with mutations identified in RT-1306 (orange), RT-41B4 (blue), and randomized mutation libraries (gray). Middle, the ribbon model of HIV-1 RT active site with key amino acid residues (F61, A62). Bottom, the sequence alignment of the three RTs. c Comparison of fluorescence intensity generated by HIV RT wildtype (WT), RT-1306, and RT-41B4 pure protein with a 33-mer RNA probe containing U15A (in red) or U15Am (in gray) as substrate. d Comparison of fluorescence intensity generated by RT-41B4 under different dNTP concentrations in the reverse transcription reaction step (“H” = 1 mM, “L” = 40 µM). e Sanger sequencing results of the cDNA products generated by RT-41B4 with Am15, Cm15, and Gm15 RNA probes under restrictive and permissive conditions. Mutations at Nm sites are indicated with arrows. f Scheme of Nm-Mut-seq pipeline based on NGS platform. g The sensitivity and specificity of Nm-Mut-seq in mapping Nm sites in human rRNA. Small black circles refer to other types of RNA modifications in rRNA. h Distribution of 1051 Nm candidates in HepG2 mRNA. i Distribution of Nm site count vs Nm fraction of three segments of HepG2 mRNA. j Scatter plot of Nm-Mut-seq data showing changes in Nm fraction at Nm sites in FBL-knockdown cells. k Pie chart of FBL hypo-regulated, hyper-regulated and independent Nm sites. l Correlation between the frequency of Nm motifs (x-axis) and the fraction of Nm motifs (y-axis) for 494 FBL hypo-regulated Nm sites. The three most frequent Gm motifs (CU(Gm)U, CU(Gm)U, and AU(Gm)U) are highlighted in red, light blue, and pink, respectively. Other motifs of a high frequency or a high average Nm fraction are marked in green. m Relative gene expression level vs Nm modification strength per mRNA at FBL hypo-regulated Nm sites in siControl HepG2 cells (Nm modification strength = the sum of Nm stoichiometric fractions at all Nm-modified sites on each mRNA).

