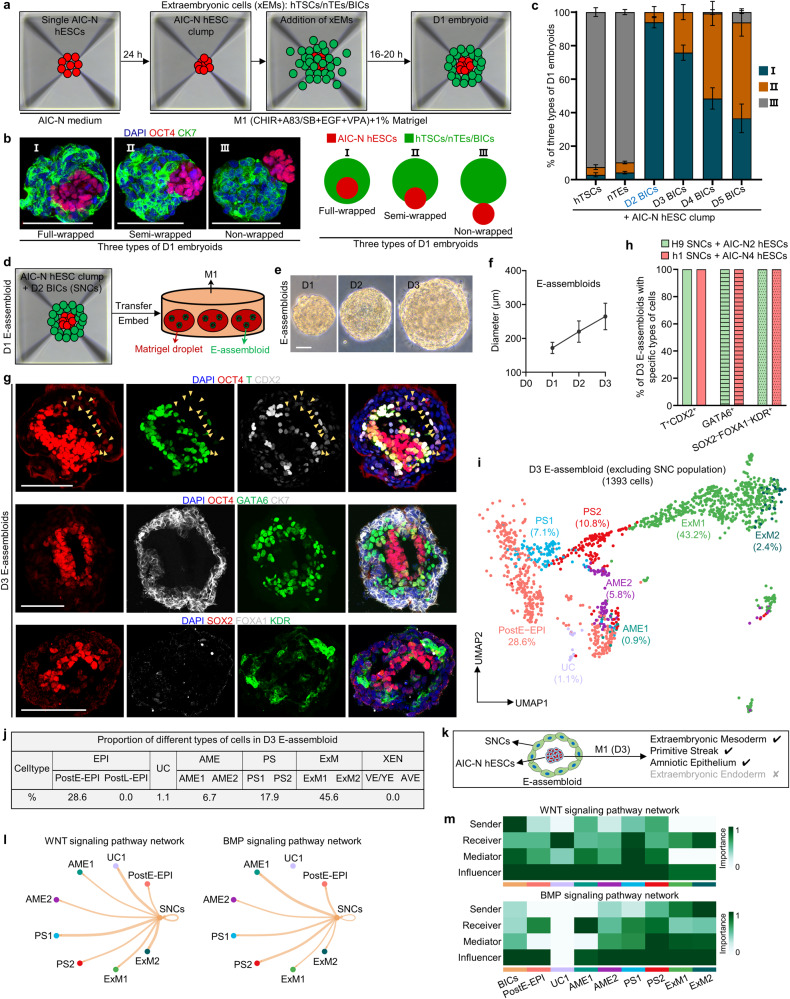
Fig. 3. Generation and extended culture of E-assembloids.
a Diagram for generating human embryoids by assembly of AIC-N hESCs and different types of xEMs. b Representative staining images (left) and schematics (right) depicting three types of D1 embryoids according to the state of AIC-hESCs wrapped by extraembryonic cells (xEMs). CK7 for xEMs, and OCT4 for AIC-N hESCs. c Quantification of three types of D1 embryoids derived from AIC-N hESCs and different types of xEMs. Three independent experiments; more than 100 embryoids were quantified for each experimental group. Data are presented as mean ± SD. A large number of dead cells surround the embryoid assembled from D1 BICs (Supplementary information, Fig. S3l), and therefore, these embryoids were not used for further study. d Diagram of extended culture of human E-assembloids assembled from AIC-N hESCs and D2 BICs (SNCs). e Representative phase contrast images of E-assembloids during extended culture in the M1 condition. f Dynamic diameters of E-assembloids during extended culture in the M1 condition. n = 3 independent experiments; at least 100 E-assembloids were quantified in each experiment; data are presented as mean ± SD. g Immunostaining of D3 E-assembloids with specific lineage markers. Yellow arrowheads indicate AMELCs. h Quantification of different types of E-assembloids indicated in g. Three independent experiments; at least 100 E-assembloids were quantified in each experiment; data are presented as mean ± SD. i UMAP visualization of integration analysis of the remaining cell types after excluding TrB and SNC populations from human embryos and D3 E-assembloids, respectively. j Proportion of different subtypes of cells indicated in i based on analysis of scRNA-seq data. k Schematic diagram showing the specifications of indicated cell lineages in D3 E-assembloids. l The inferred WNT and BMP signaling outputs from SNCs; line weight represents the communication probability. m Heatmap shows the relative importance of each cell group based on the computed four network centrality measures of WNT and BMP signaling network. Scale bars, 100 µm. See also Supplementary information, Figs. S3 and S4.

