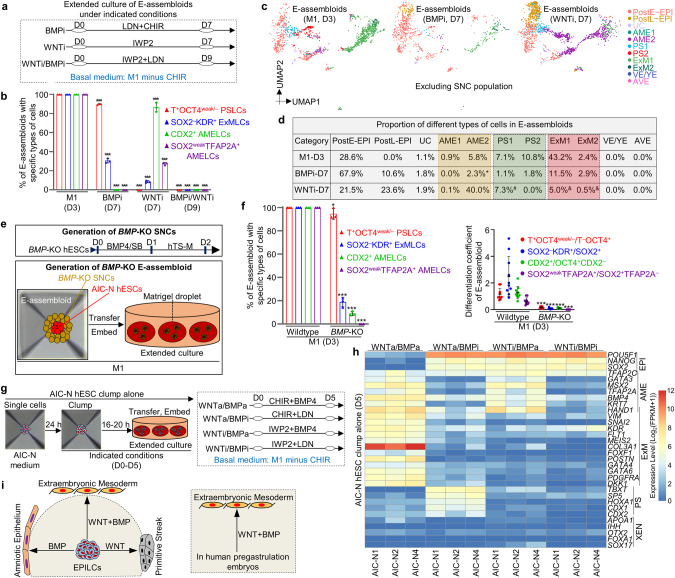
Fig. 4. WNT and BMP signaling pathways orchestrate lineage development.
a Schematic diagram of different culture conditions for E-assembloids. BMPi and WNTi represent BMP inhibition and WNT inhibition, respectively. Compared to the M1 condition, BMP or/and WNT inhibition delayed/blocked EPILC development in E-assembloids toward embryonic and extraembryonic lineages, and we therefore prolonged culture of E-assembloids to observe the potential effects of WNT or/and BMP inhibition (7 days for individual inhibition and 9 days for dual inhibition). b Quantification of different types of E-assembloids cultured in the indicated conditions at the indicated time points. n = 3 independent experiments; at least 100 E-assembloids were quantified in each experiment; data are presented as mean ± SD. ***P ≤ 0.001 with Student’s t-test. c UMAP visualization of integration analysis of the remaining cell types after excluding TrB and SNC populations from human embryos and E-assembloids grown in the indicated conditions, respectively. d Proportion of different cell subtypes in E-assembloids cultured in the indicated conditions at different time points (see also Supplementary information, Fig. S5d). *These cells were clustered into AME2, but weakly co-expressed AME, PS and ExM marker genes, indicating an uncertain identity; #these cells were clustered into PS1 and co-expressed pluripotency and AME but not PS marker genes, implying a nascent amnion identity; &these cells were clustered into ExM1/2 and highly expressed AME but not ExM marker genes, implying a amnion identity. e Diagram of generation of BMP-KO H9 SNCs (top) and BMP-KO E-assembloids (bottom, see also Supplementary information, Fig. S5e). f Proportion (left) and differentiation coefficient (right) of different types of E-assembloids (wild type and BMP-KO) grown in the M1 condition on D3. The differentiation coefficient represents the ratio of differentiated cells to pluripotent cells. For the proportion, n = 3 independent experiments; at least 100 E-assembloids were quantified in each experiment; for the differentiation coefficient, 10 E-assembloids were randomly selected for statistics in each group. Data are presented as mean ± SD. *P ≤ 0.05 and ***P ≤ 0.001 with Student’s t-test. g Schematic diagram of AIC-N hESC clumps cultured alone in different culture conditions for 5 days. WNTa and BMPa represent WNT activation and BMP activation, respectively. h Heatmap of representative marker genes of different lineages from three AIC-N hESC lines cultured in the indicated conditions. i Functional diagram of WNT and BMP signaling pathways on embryonic lineage development. CHIR CHIR99021, LDN LDN193189-2HCl, SB SB431542. See also Supplementary information, Fig. S5.

