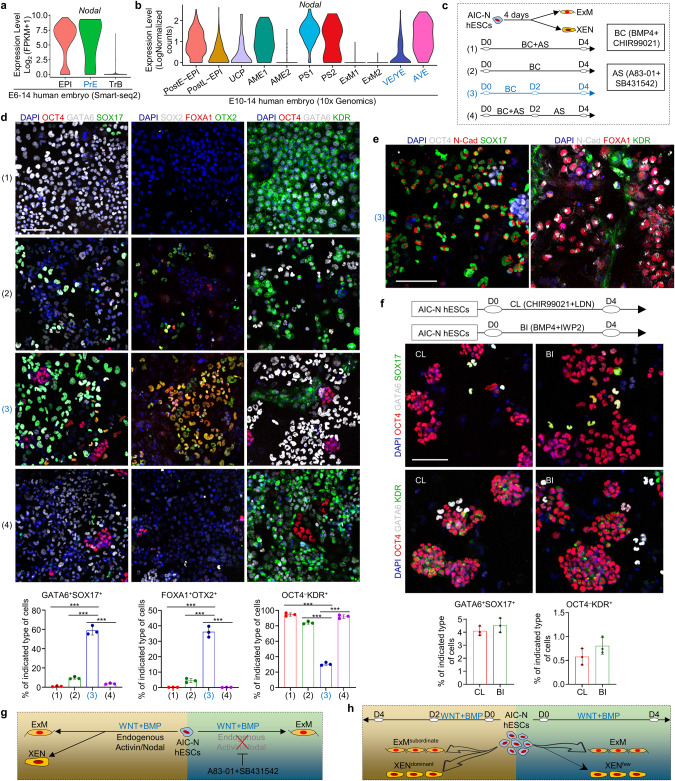
Fig. 5. Extraembryonic endoderm specification.
a, b Violin plots of Nodal gene expressed in different types of cells by scRNA-seq data. a published smart-seq2 data.4 b 10× Genomics data. c Functional experiment of WNT, BMP and Nodal signals on XENLC and ExMLC specifications. d Representative staining images showing the specifications of XENLCs and ExMLCs and proportion of the indicated cell types under different culture conditions. n = 3 independent experiments; data are presented as mean ± SD. ***P ≤ 0.001 with Student’s t-test. e Representative staining images showing the specifications of XENLCs and ExMLCs under Condition (3). f Schematic diagram of culture conditions (top), representative staining images (middle) and proportion of different cell types (bottom) under the indicated culture conditions. n = 3 independent experiments; data are presented as mean ± SD. g, h Functional schematic diagram of WNT, BMP and Nodal signals on the specifications of XENLCs and ExMLCs. LCs, -like cells; scale bars, 100 µm.

