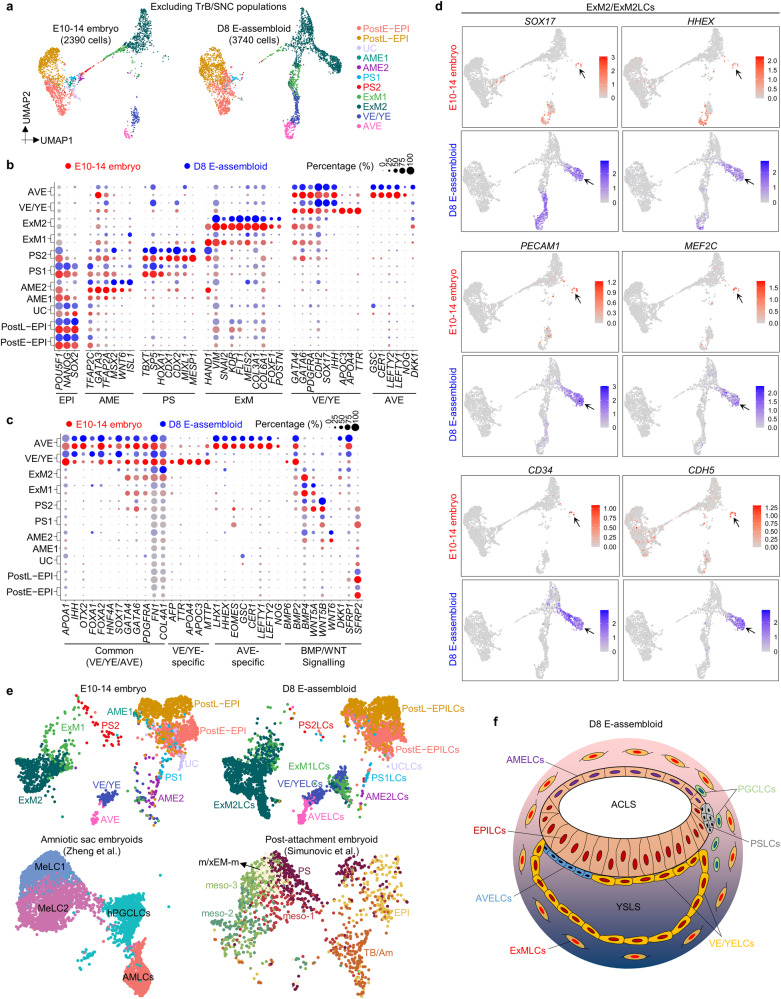
Fig. 7. Comparative single-cell transcriptomics of E-assembloids and 3D-cultured embryos.
a UMAP visualization of integration analysis of the remaining cell types after excluding TrB and SNC populations in human embryos and D8 E-assembloids, respectively. b, c Dot plots of candidate genes specific for the indicated cell subtypes in human embryos and D8 E-assembloids. d UMAP plots of the indicated genes expressed in D8 E-assembloids and 3D-cultured embryos. Some cells in ExM2 population exhibit haemato-endothelial characteristics (arrow). e Comparative integration analysis of scRNA-seq datasets from 3D-cultured human embryos, E-assembloids and two other embryo models.10,14 f Schematic diagram showing 3D morphological feature of D8 E-assembloid. MeLC mesoderm-like cell, m/xEM-m mesoderm/extraembryonic mesoderm, meso mesoderm, TB/Am trophoblast/amnion. See also Supplementary information, Fig. S7.

