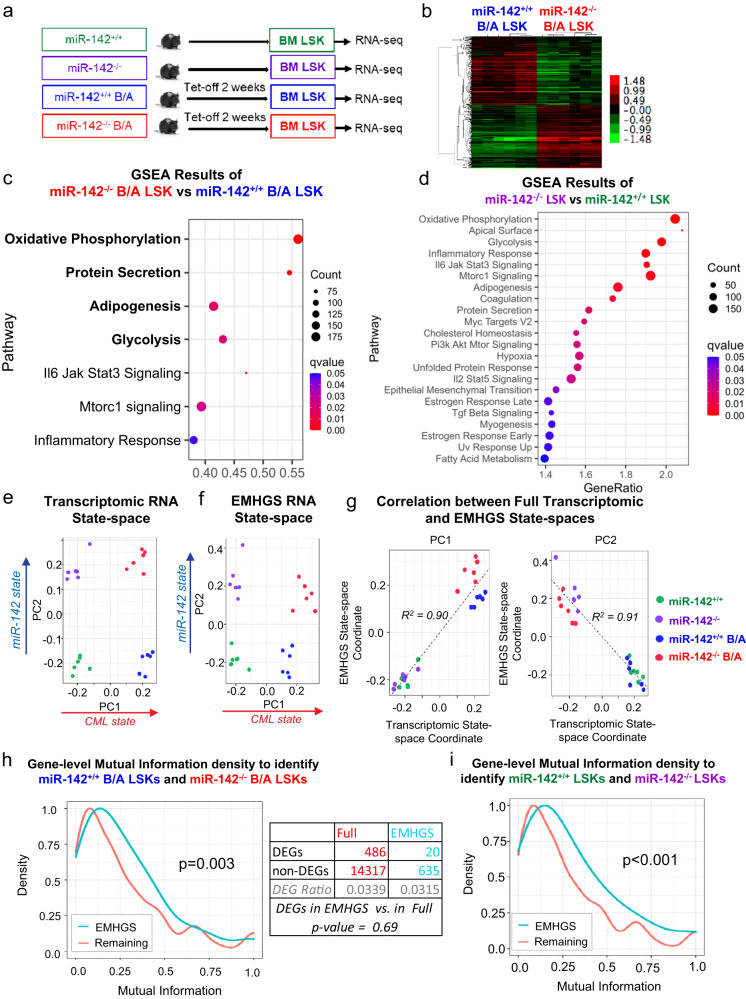
Fig. 3. State-transition of CP-LSCs to BC-LSCs is characterized by changes in the expression of genes involved in the bioenergetic oxidative metabolism.
a Experimental design. BM LSKs from miR-142+/+ (wt), miR-142−/− (miR-142 KO), miR-142+/+BCR-ABL (CP CML) and miR-142−/−BCR-ABL (BC CML) mice (2 weeks after Tet-off and BCR-ABL induction) were sorted for RNA-seq. b 506 differentially expressed genes, 211 upregulated and 295 downregulated, were identified in miR-142−/−/BCR-ABL LSKs vs miR-142+/+/BCR-ABL LSKs. c, d The upregulated gene sets by GSEA using Hallmark gene sets in c miR-142−/−BCR-ABL LSKs vs miR-142+/+BCR-ABL LSKs and d miR-142−/− LSKs vs miR-142+/+ LSKs. For GSEA, see methods for details. e Using singular value decomposition (SVD) on the whole transcriptome, a state-space was constructed that separates the four experimental conditions. PC1 separated CML from non-CML samples, whereas PC2 separated miR-142 KO from wt samples. f By performing SVD on the 655 genes of the EMHGS, the EMHGS state-space was constructed and found to be highly similar to the whole transcriptome state-space. g Plotting the whole transcriptome and EMHGS state-space coordinates for both PC1 and PC2 confirmed that the state-spaces were similar (R2 = 0.90 and R2 = 0.91 respectively). h The density of mutual information (MI) of the EMHGS genes vs the remaining transcriptome (whole transcriptome minus EMHGS) was determined by calculating the MI for each gene using the miR-142+/+BCR-ABL LSK (CP-LSK) and miR-142−/−BCR-ABL LSK (BC-LSK) samples. The one-sided Wilcoxon rank sum test was used to determine that the EMHGS had higher MI density (MI distribution shifted toward higher values) compared to the remaining transcriptome (p = 0.003). The table compared the number of BC-LSK vs CP-LSK differentially expressed genes (DEGs) found in the “remaining” transcriptome (full transcriptome minus the EMHGS genes) with the number of DEGs found in the EMHGS. DEGs contained in the EMHGS showed no significant difference compared to the DEGs contained in the “remaining” transcriptome (hypergeometric p-value = 0.69). i The MI density of the EMHGS genes vs the remaining transcriptome (whole transcriptome minus EMHGS) was determined by calculating the MI for each gene using the miR-142+/+ LSK (WT) and miR-142−/− LSK (KO) samples (one-sided Wilcoxon rank sum test, p < 0.001). For e–i, source data are provided as a Source Data file.

