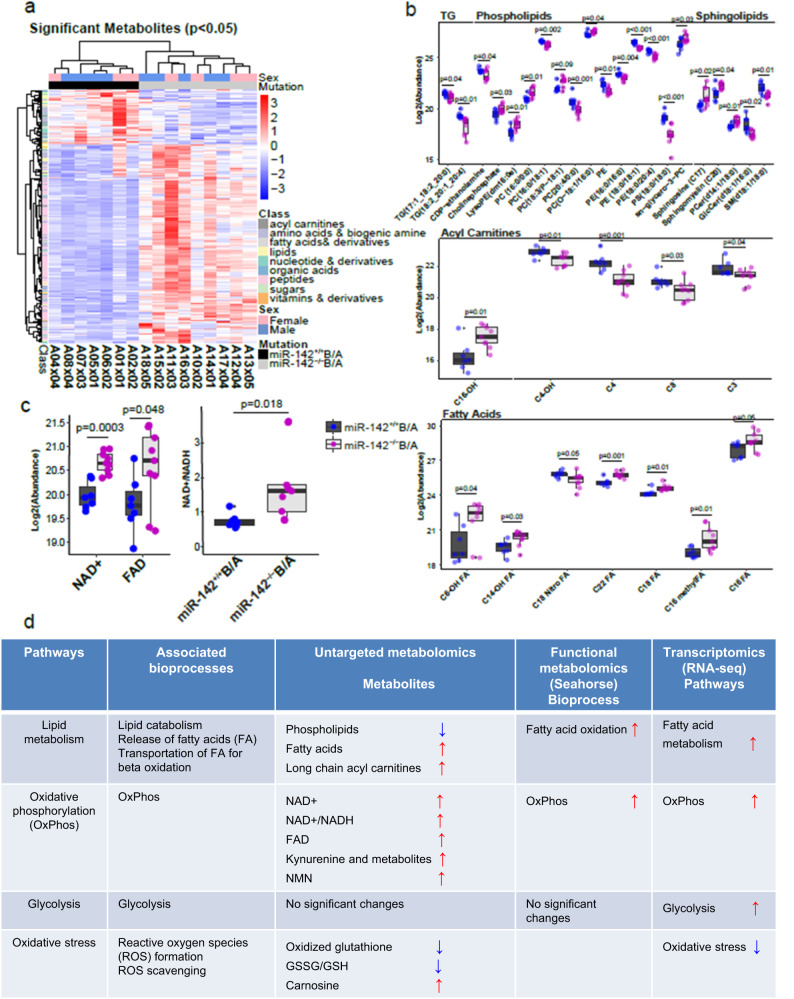
Fig. 4. Metabolomic differences between CP-LSCs and BC-LSCs.
a Hierarchical unsupervised clustering represents 301 differently abundant (p < 0.05) metabolites (acyl carnitines, fatty acids, fatty alcohols, lipids, amino acids and biogenic amines, nucleotides and derivatives, organic acids and sugars) in BM Lin-c-Kit+ cells isolated from miR-142−/−BCR-ABL and miR-142+/+BCR-ABL mice (BCR-ABL were induced for 4 weeks by tetracycline withdrawal). Comparison between groups was performed by two-tailed, paired Student’s t-test. b Box and Whisker plots depicting relative log2 abundances of significantly different complex lipids including triglycerides (TG), phospholipids and sphingolipids, fatty acyl carnitines and free fatty acids in miR-142−/−BCR-ABL (n = 9 biologically independent samples) vs miR-142+/+BCR-ABL (n = 7 biologically independent samples) Lin-c-Kit+ cells. Individual p-values for all 33 metabolites are available in Supplementary Data 2. c Box and Whisker plots showing the log2 relative abundances of NAD+ (complex I product) (p = 0.00025), FAD (complex II product, p = 0.048), and the NAD+/NADH ratio (Complex I product/substrate ratio, p = 0.018) in miR-142−/−BCR-ABL (n = 9 biologically independent samples) vs miR-142+/+BCR-ABL (n = 7 biologically independent samples) Lin-c-Kit+ cells. For b, c, a two-sided Student’s t-test was used to compare KO versus WT cells. Data presented in boxplots show the median as represented by the center line, with the range of the box from the 25th percentile to the 75th percentile, and whisker lines stretching to 1.5× the IQR below the 25th percentile and 1.5× the IQR above the 75th percentile. Any points in the boxplot not represented within these ranges (above 1.5× the 75th percentile or below 1.5× the 25th percentile) are represented as individual black points. All individual data points are overlayed on the boxplots for miR-142+/+ (blue) and miR-142−/− (purple) cells. For b, c, source data are provided as a Source Data file. d Table describing significant changes observed in metabolic pathways and biochemical processes upon comparing miR-142−/−BCR-ABL with miR-142+/+BCR-ABL cells using untargeted metabolomic analysis (Lin-c-Kit+ cells), functional seahorse analysis (LSK), and transcriptomic analysis (LSK).

