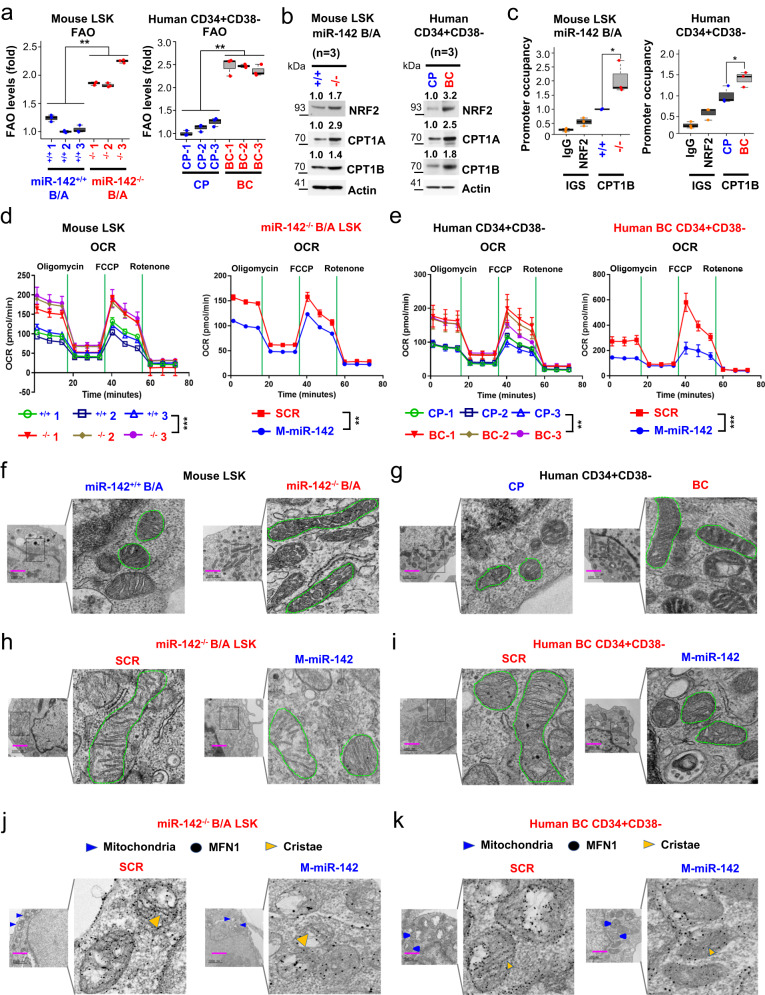
Fig. 5. Effects of miR-142 expression on mitochondrial morphology and metabolism in leukemic stem cells.
a–c LSKs and CD34+CD38− cells were respectively isolated from miR-142+/+BCR-ABL vs miR-142−/−BCR-ABL mice (left) or from human CP vs BC CML patients (right). a Levels of FAO (left, p = 0.0048; right, p = 0.0023). b Immunoblotting of NRF2, CPT1A and CPT1B protein. Three samples of each group were pooled for the assay (n = 3 biologically independent samples). Densitometry quantifications (fold) are shown on the top. Source data are provided as a Source Data file. c ChIP assay to measure NRF2 binding to CPT1B promoter levels (left, p = 0.016; right, p = 0.0307). Box plot with median value and first/third quartiles and whiskers together with minimum and maximum values are shown (n = 3 biologically independent samples). d, e Levels of OxPhos (as indicated by OCR levels in Seahorse assay) in d LSKs from miR-142+/+BCR-ABL vs miR-142−/−BCR-ABL mice (d, left) or e CD34+CD38− cells from human CP vs BC CML patients (e, left). Mouse miR-142−/−BCR-ABL LSKs (d, right, n = 3 biologically independent samples) or human CD34+CD38− BC CML cells (e, right, n = 3 biologically independent samples) were treated with SCR control or CpG-M-miR-142 (2 µM) for 24 h (d: left, p = 0.0008; right, p = 0.0014; e: left, p = 0.0054; right, p = 0.0009). For a–e, results from one of the three independent experiments are shown (n = 3). Comparison between groups was performed by one-tailed, unpaired t-test. Results shown represent mean ± SD. Significance values: *p < 0.05; **p < 0.01; ***p < 0.001; ****p < 0.0001; ns, not significant. Effects of miR-142 expression on mitochondria fusion in LSCs. Evidence of mitochondria fusion in f LSKs from miR-142+/+BCR-ABL vs miR-142−/−BCR-ABL mice and g CD34+CD38− cells from human CP vs BC CML patients. h–k Effects of correction of miR-142 deficit on mitochondria fusion. Indicated cells were treated with SCR control or CpG-M-miR-142 (500 nm) for 24 h. h, i Mitochondria morphology was shown by electron microscope. j, k Levels of MFN1 protein expression (black dots) inside mitochondria and effect of CpG-M-miR-142 visualized by immunolabeling-electron microscope. For a–e, source data are provided as a Source Data file. For f–k, scale bar, 1000 nm, results from one of the three independent experiments are shown (n = 3). miR-142+/+B/A miR-142+/+BCR-ABL, miR-142−/−B/A miR-142−/−BCR-ABL, CP chronic phase, BC blast crisis, FAO fatty acid oxidation, ChIP chromatin immunoprecipitation, OCR oxidative consumption rate, M-miR-142 CpG-M-miR-142, SD standard deviation.

