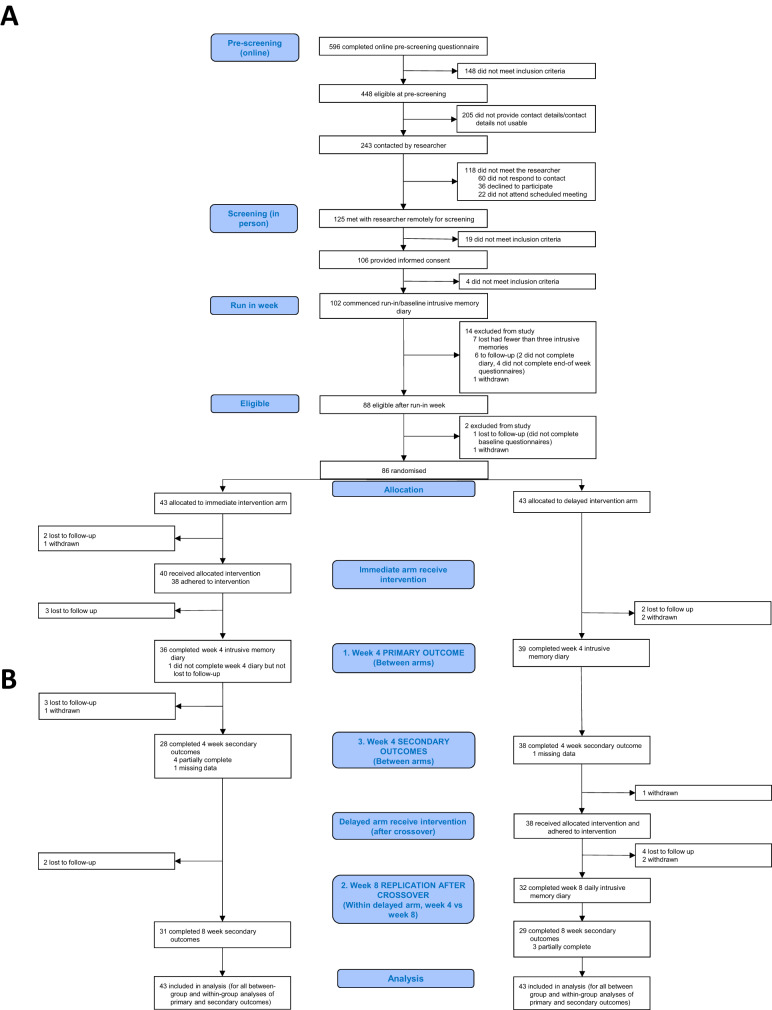
Fig. 2. Trial Profile.
CONSORT diagram showing enrolment, allocation, primary and secondary outcomes, and analysis populations. A Enrollment and Allocation. CONSORT diagram showing enrollment and allocation, as is presented in Ramineni et al. [1]. B Primary and Secondary Outcomes. CONSORT diagram showing primary and secondary outcomes at week 4 and week 8. The blue boxes labelled 1–3 outline the main primary and secondary comparisons. 1. Primary analysis: between-group comparison of intrusive memories at week 4. 2. Secondary analyses: within-group comparisons in the delayed arm from week 4 to week 8 (after crossover). 3. Secondary analyses: between-group comparisons of other secondary outcomes at week 4.

