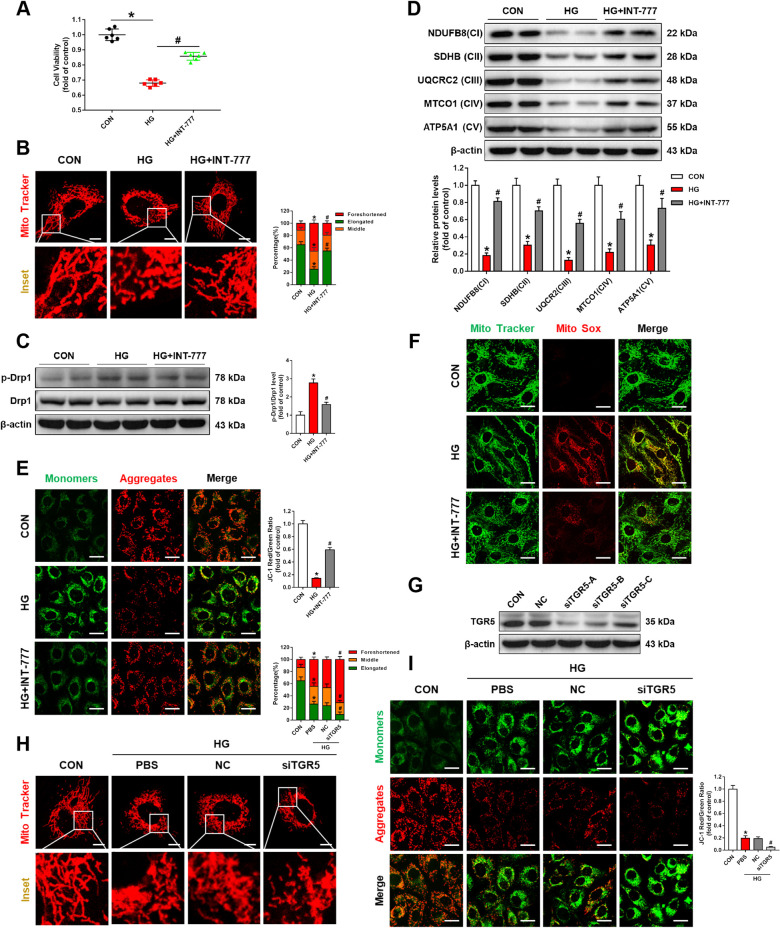
Fig. 1. TGR5 activation alleviates Müller cell injury by reducing mitochondrial damage in DR.
Müller cells were treated with HG (high glucose, 33 mM) for 48 h in DMEM with 2% FBS in the presence or absence of INT-777 (A–F) or TGR5 siRNA (G–I). The INT-777 (30 μM) were added 2 h before HG stimulation, and also existed during HG stimulation. For siRNA assay, transfection was done 24 h before HG treatment. A Cell proliferation was determined by CCK-8 (n = 6). B Representative confocal images and bar graph showing mitochondrial network morphology. Scale bars = 10 μm. C Representative western blot showing p-Drp1and Drp1 protein levels (n = 3). D Representative western blot showing NDUFB8, SDHB, UQCRC2, MTCO1, and ATP5A1 protein levels in Müller cells (n = 3). E Representative confocal images of JC-1 staining and bar graph showing MMP. Scale bars = 25 μm. F Representative confocal images of MitoSOX™ Red and Mito-Tracker Green staining showing mtROS in Müller cells. Scale bars = 25 μm. G Western blot shows transfection efficiency of TGR5 in Müller cells. H Representative confocal images and bar graph showing mitochondrial network morphology in Müller cells transfected with TGR5 siRNA under HG stimulation. Scale bars = 10 μm. I Representative confocal images of JC-1 staining and bar graph showing MMP in Müller cells. Scale bars = 25 μm. Data are presented as mean ± SD, *p < 0.05 versus control (CON) group, #p < 0.05 versus HG group.

