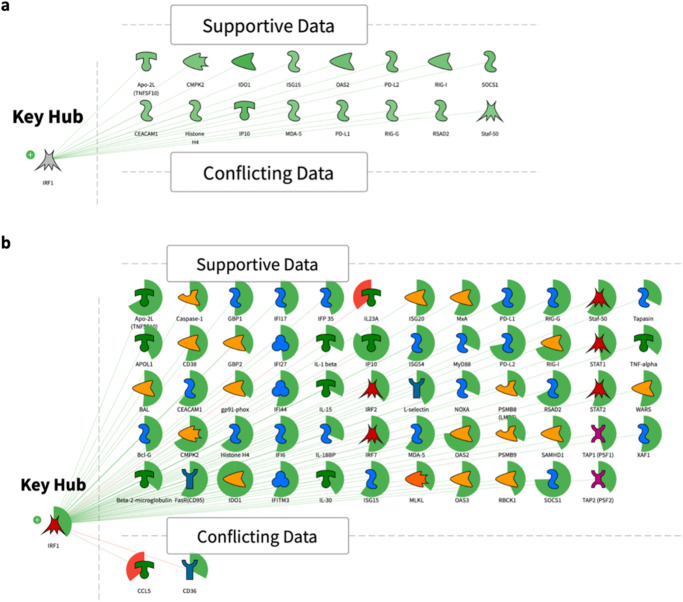
Fig. 2. Causal reasoning networks.
a Causal reasoning network of highest confidence transcription factor IRF1 using DEGs in GS1. b Causal reasoning network of highest confidence transcription factor IRF1 using DEGs in GS2. Gene expression changes are shown in green and red sectors around each molecule. Increased expression value corresponds to the green sector which size increases clockwise around the molecule icon. Decreased expression value corresponds to the red sector which size increases counterclockwise. Supportive data panel contains over and under-expressed genes from the experimental data set which support a hypothesis that IRF1 is in a predicted predominant “active” state. Conflicting data panel contains over and under-expressed genes from the experimental data set which are discordant with the hypothesis that IRF1 is in predicted predominant “active” state.

