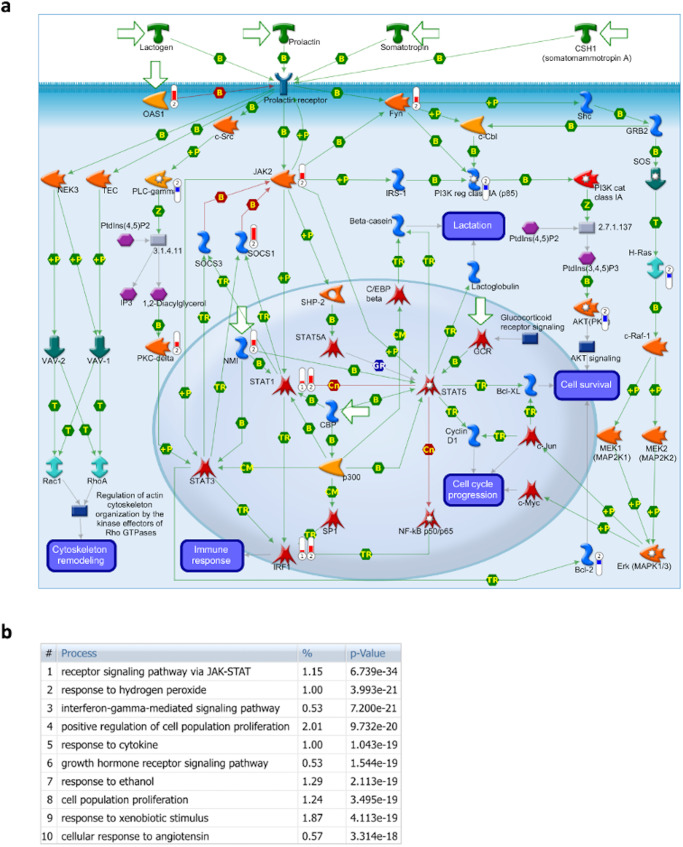
Fig. 5. Prolactin signaling pathway.
a Prolactin signaling pathway map. A node (or object) on the map could be a gene, protein or chemical compound. Query genes from experimental data which intersect with pathway protein or chemical compound. Query genes from experimental data which intersect with pathway objects are denoted by thermometers. Thermometer 1 represents causal transcription factors. Thermometer 2 represents DEGs in response to treatment with vaccine, applying thresholds of log2FC ≥ 2.00 or ≤ −2.00, and FDR ≤ 0.05. b Biological processes involved in prolactin signaling pathway. The % refers to the percentage of network objects in the pathway map. The p-value is the process prediction p-value.

