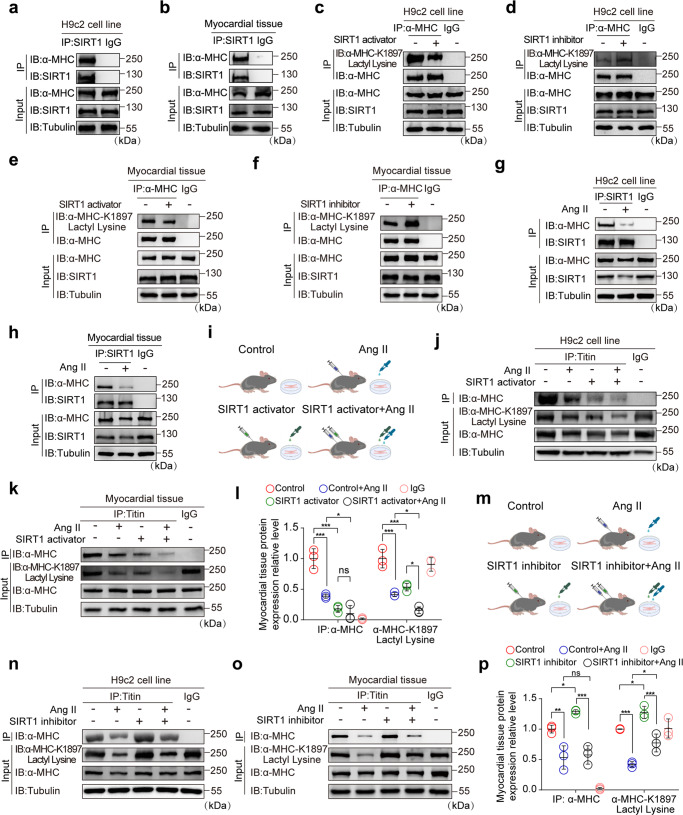
Fig. 4. SIRT1 is the delactylase for α-MHC K1897.
a–h H9c2 cells (a) or myocardial tissues (b) were lysed and immunoprecipitated using anti-SIRT1 antibody or control IgG, followed by detection of α-MHC. H9c2 cells (c) and myocardial tissues (e) treated with or without SIRT1 activator were lysed and immunoprecipitated using anti-α-MHC antibody or control IgG, followed by detection of α-MHC K1897 Lactyl Lysine. H9c2 cells (d) and myocardial tissues (f) treated with or without SIRT1 inhibitor were lysed and immunoprecipitated using anti-α-MHC or control IgG, followed by detection of α-MHC K1897 Lactyl Lysine. H9c2 cells (g) and myocardial tissue (h) treated with or without Ang II were lysed and immunoprecipitated using anti-SIRT1 antibody or control IgG, followed by detection of α-MHC. i Schematic of experimental intervention patterns (control, Ang II, SIRT1 activator, combination of Ang II and SIRT1 activator) in mice and H9c2 cells. j, k H9c2 cells (j) and myocardial tissues (k) indicated in i were lysed and immunoprecipitated using anti-Titin or control IgG, followed by detection of α-MHC. l Quantification of the interaction of α-MHC with Titin and the relative expression level of α-MHC K1897 Lactyl Lysine in k. Tubulin was used as an internal reference (n = 3 per group). m Schematic of experimental intervention patterns (control, Ang II, SIRT1 inhibitor, combination of Ang II and SIRT1 inhibitor) in mice and H9c2 cells. n, o H9c2 cells (n) and myocardial tissues (o) indicated in m were lysed and immunoprecipitated using anti-Titin or control IgG, followed by detection of α-MHC. p Quantification of the interaction of α-MHC with Titin and the relative expression level of α-MHC K1897 Lactyl Lysine in o. Tubulin was used as an internal reference (n = 3 per group). Data are presented as mean ± SD (l, p). Statistical significance was assessed by two-way ANOVA with Bonferroni multiple comparisons test (P values adjusted for 6 comparisons; ns, no significance; *P < 0.05; **P < 0.01; ***P < 0.001).

