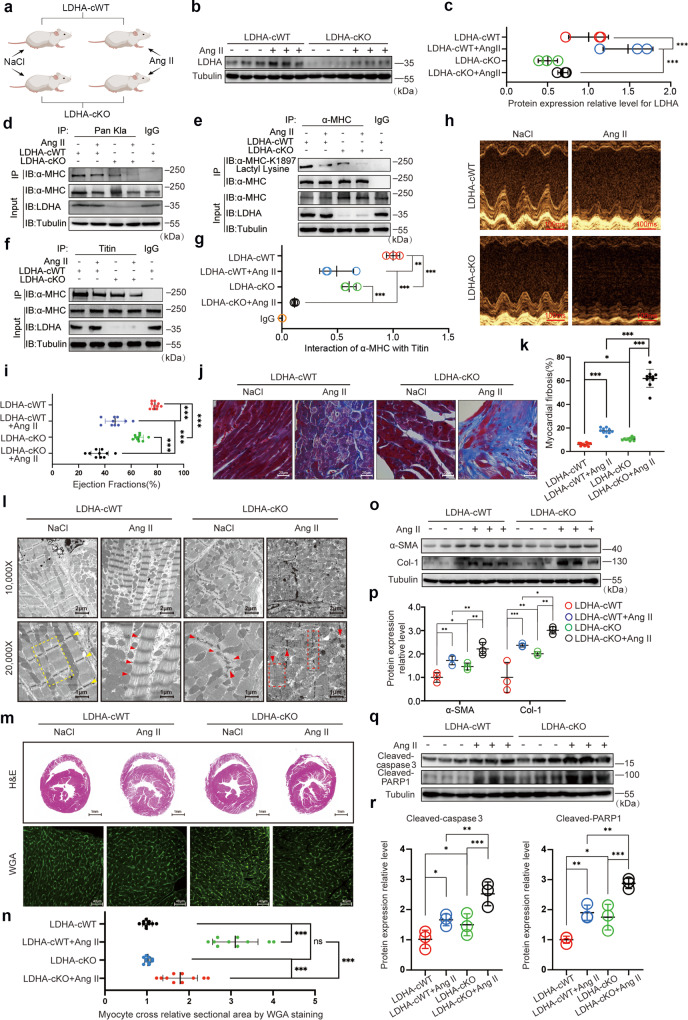
Fig. 6. LDHA-cKO mice decreases α-MHC K1897 lactylation and aggravates heart failure.
a Schematic for experimental intervention patterns in mice. Micro-osmotic pumps were used to deliver NaCl or Ang II subcutaneously to LDHA-cKO and LDHA-cWT mice. b WB assay assessed LDHA expression levels in myocardial tissues from LDHA-cWT and LDHA-cKO mice after NaCl or Ang II treatment. c Quantification analysis of LDHA expression. d Mouse myocardial tissues indicated in a were lysed and immunoprecipitated using anti-Pan kla antibody or control IgG, followed by detection of α-MHC. e Mouse myocardial tissues indicated in a were lysed and immunoprecipitated using anti-α-MHC antibody or control IgG, followed by detection of α-MHC K1897 Lactyl Lysine. f Mouse myocardial tissues indicated in a were lysed and immunoprecipitated using anti-Titin antibody or control IgG, followed by detection of α-MHC. g Quantification of the interaction between α-MHC and Titin. Tubulin was used as an internal reference (n = 3 per group). h Representative M-mode echocardiogram of LDHA-cWT and LDHA-cKO mice after NaCl or Ang II treatment. i Cardiac function was evaluated by EF (n = 10 per group). j Masson staining to detect myocardial fibrosis. k Quantification of the fibrotic area (n = 10 per group). l Transmission electron microscope photos of heart tissue ultrastructure in LDHA-cWT and cKO mice after NaCl or Ang II treatment. The yellow dotted border lines indicate the normal sarcomere structure, and the red dotted border lines indicate the damaged sarcomere structure. The arrowheads indicate Z disk in myocardial tissues. m Representative heart sections stained with H&E (top) and WGA (bottom) to detect the presence of hypertrophy in cardiac myocytes. n Quantification of relative cardiomyocyte cross-sectional area (n = 10 per group). o, p WB and quantification of fibrosis marker (α-SMA, Col-1) levels in myocardial tissues. Tubulin was used as an internal reference (n = 3 per group). q, r WB and quantification of cardiac injury marker (cleaved-Caspase3 and cleaved-PARP1) levels in myocardial tissues. Tubulin was used as an internal reference (n = 3 per group). Data are presented as mean ± SD (c, g, i, k, n, p, r). Statistical significance was assessed by two-way ANOVA with Bonferroni multiple comparisons test (P values adjusted for 6 comparisons; ns, no significance; *P < 0.05; **P < 0.01; ***P < 0.001).

