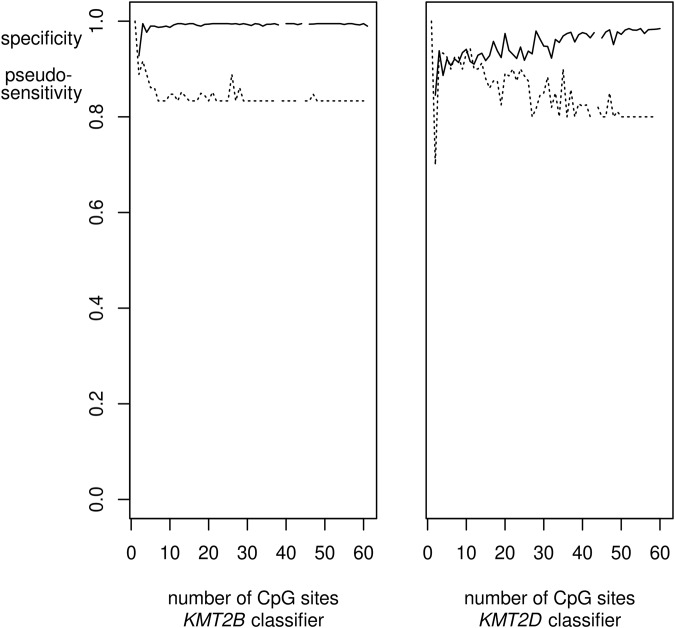
Fig. 1. SVM-classifier performance as a function of episignature length.
The performances of SVM episignature-classifiers for KMT2B and KMT2D after the third re-training (cf. Fig. 2) are shown as a function of their length, that is, the number k of CpG-sites included in the episignature. Selection of sites by the ensemble bootstrap version of the mRMR algorithm was varied by varying the number of bootstraps and the length of the mRMR solutions. For each k the average specificity of the classifiers of that length was calculated (solid line). Analogously, a pseudo-sensitivity (dashed line) was calculated as the average number of variants verified as pathogenic by the classifiers of length k divided by the maximal number of (seemingly) verified variants by any of the classifiers for the respective gene. The specificities reached their plateaus for k ≥ 4 in case of KMT2B and k ≥ 49 in case of KMT2D. Pseudo-sensitivities stabilized at k ≥ 30 and k ≥ 49, respectively. Since not all k were realized by the selection procedure, the curves have small gaps.

