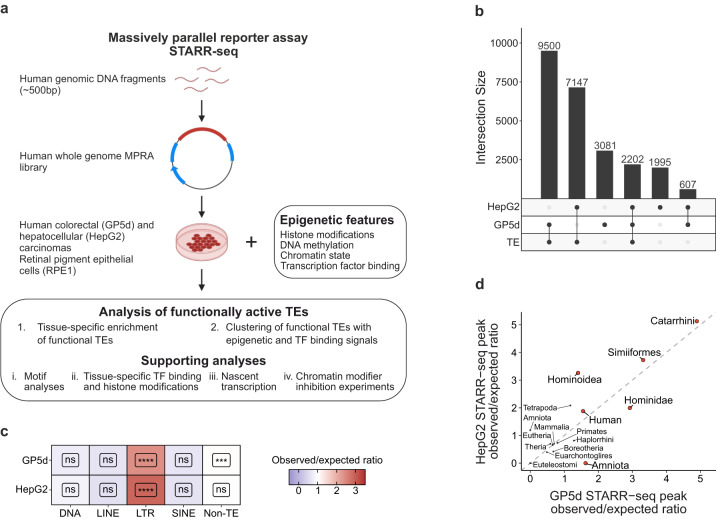
Fig. 1. Long terminal repeats are enriched within active enhancers identified by STARR-seq.
a Schematic representation of the analysis pipeline. b Upset plot for overlap analysis of STARR-seq peaks with TEs in GP5d and HepG2 cells with the number of peaks in each category indicated; total number of peaks 15,390 and 11,951 in GP5d and HepG2 cells, respectively. c Ratio of observed vs. expected overlaps for all GP5d and HepG2 STARR-seq peak summits with the major classes of TEs (DNA, LINE, LTR, and SINE) and the non-TE genome. BH-adjusted one-sided binomial test FDR is shown for each class (Significance symbols: **** indicates p < 0.0001, ***p < 0.001, **p < 0.01, *p < 0.05, ns = non-significant, p > 0.05). GP5d LTR p < 2.2e-16, GP5d Non-TE p = 4.331607e-04, HepG2 LTR < 2.2e-16. d Enrichment of all STARR-seq peak summits at TEs classified by lineage significant in both GP5d and HepG2 cells. TE subfamilies were grouped by their lineage of origin and the observed/expected ratio of STARR-seq peak summits at the TE lineage groups was calculated. TE lineages significant in both GP5d and HepG2 (BH-adjusted one-sided binomial test FDR < 0.01) are labeled in red, gray points are statistically insignificant. Source data are provided as a Source Data file.

