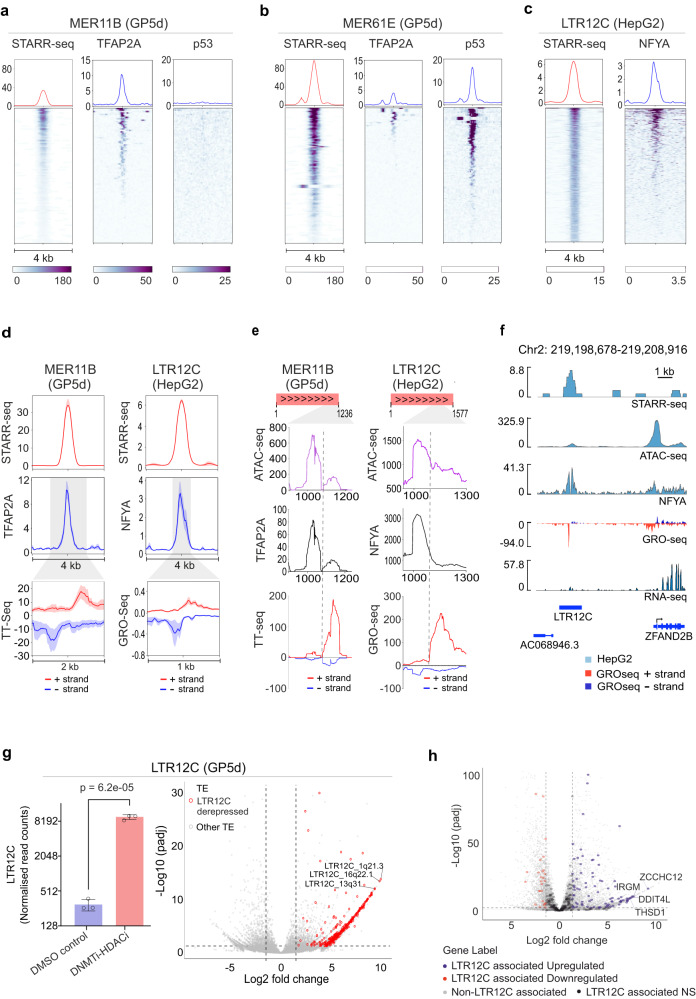
Fig. 4. Distinct TFs regulate cell type-specific transcriptionally active TE enhancers.
a, b Heatmap of STARR-seq and ChIP-seq signals for TFAP2A and p53 at MER11B (a) and MER61E (b) elements overlapping a STARR-seq peak in GP5d cells. c Heatmap of STARR-seq and ChIP-seq signals for NFYA at LTR12C elements overlapping a STARR-seq peak in HepG2 cells. d Left panel: metaplots of STARR-seq, TFAP2A ChIP-seq, and TT-seq signals at MER11B elements overlapping a STARR-seq peak in GP5d cells. Right panel: metaplots of STARR-seq, NFYA ChIP-seq, and GRO-seq signals at LTR12C elements overlapping a STARR-seq peak in HepG2 cells. All metaplots show the average signal with standard error. e ATAC-seq, TFAP2A ChIP-seq, and TT-seq reads in GP5d mapped to MER11B elements overlapping STARR-seq peaks were extracted and mapped to the MER11B consensus sequence. Left panel shows metaplots of the signals in a region from 900 to 1236 bp of the MER11B consensus sequence. Similarly, ATAC-seq, NFYA ChIP-seq, and GRO-seq reads in HepG2 mapped to LTR12C elements overlapping a STARR-seq peak were extracted and mapped to the LTR12C consensus sequence. Right panel shows metaplots of the signals in a region from 900 to 1300 bp of the LTR12C consensus sequence. f Genome browser snapshot showing STARR-seq, ATAC-seq, NFYA ChIP-seq, GRO-seq, and RNA-seq signal at a LTR12C element overlapping a STARR-seq peak in HepG2 cells. g Changes in TE expression in GP5d cells upon DNMT and HDAC co-inhibition on a subfamily and locus level (see Methods for details). Left panel: the normalized RNA-seq read counts for the LTR12C subfamily with and without the inhibitor treatment (mean ± SD, individual data points for three biological replicates shown as dots; two-sided unpaired t test). Right panel: volcano plot of differentially expressed TEs after the co-inhibition. 498 upregulated LTR12C elements are highlighted in red. h Volcano plots representing gene expression changes for LTR12C-associated genes upon inhibition of DNMT and HDAC in GP5d cells. Analysis of differentially expressed genes in GP5d wild-type cells with DNMT and HDAC inhibition revealed significant upregulation of genes in the vicinity of LTR12C elements (±50 kb). Source data are provided as a Source Data file.

