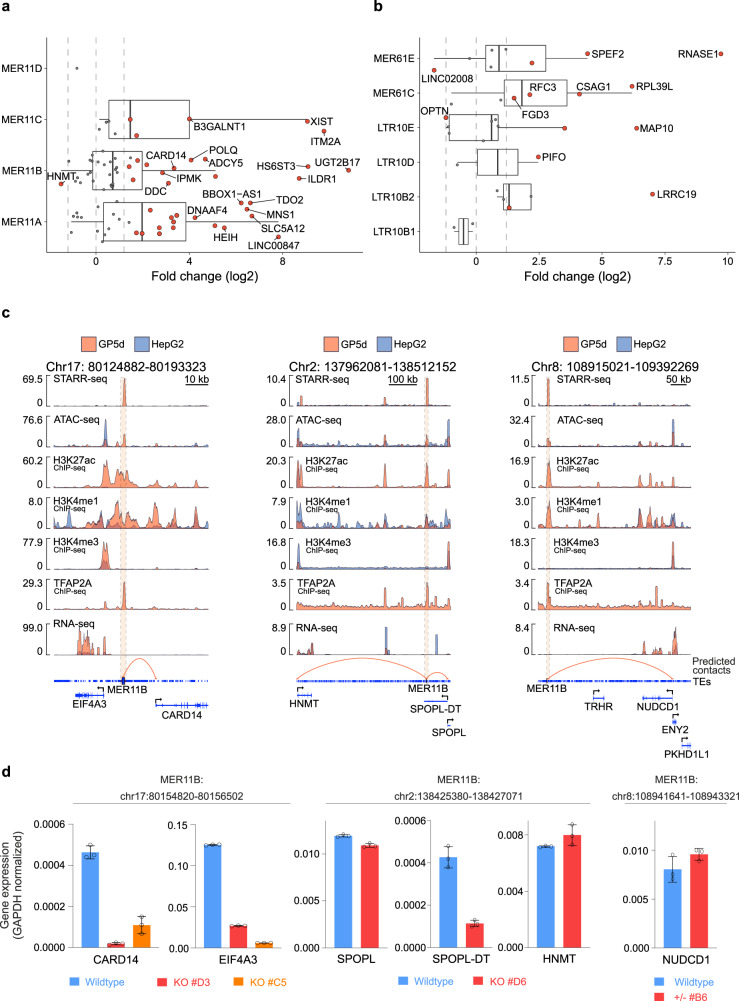
Fig. 6. In silico-predicted TE enhancer-gene contacts show widespread changes in gene expression validated by in vivo CRISPR genome editing.
a Differential expression of genes with predicted contacts to MER11 subfamily TEs. Log2 fold change (Log2FC) is shown from RNA-seq data for GP5d vs. HepG2 cells. Red points mark significantly differentially expressed (|Log2FC|> 1.2 and FDR < 0.05), and blue points are insignificant. Log2FCs of ±1.2 and 0 are marked with dashed lines. Boxplots indicate the median (center line), the third and first quartiles (box limits), and 1.5 × IQR above and below the box (whiskers). (n = 80 predicted contacts). b Differential expression of genes with predicted contacts to p53-specific TEs from RNA-seq data between GP5d WT vs. HepG2 cells. Plot elements are like in a. (n = 32 predicted contacts). c Genome browser snapshots of three active MER11B elements with high STARR-seq signal in GP5d cells. Each panel shows the highlighted TE locus with signal tracks in GP5d and HepG2 cells for STARR-seq, ATAC-seq, ChIP-seq for TFAP2A and histone marks, RNA-seq, and predicted enhancer-gene contacts from the ABC analysis. CARD14 in the left panel, HNMT, SPOPL, and SPOPL-DT in the middle panel, and NUDCD1 in the right panel were predicted as gene targets for the MER11B elements. These MER11B elements mostly show STARR-seq activity and canonical epigenetic marks of enhancers in GP5d, likely reflected in the low expression of the target genes in HepG2. d RT-qPCR data showing changes in mRNA expression for genes with predicted contacts to active MER11B elements upon CRISPR-Cas9 mediated deletion of the elements in GP5d cells (GAPDH normalized). Two independent clones with homozygous enhancer deletion were analyzed for MER11B element at chromosome 17 in the vicinity of CARD14 and EIF4A3 (shown in Fig. 6c) and one for MER11B at chromosome 2 flanked by SPOPL, SPOPL-DT and HNMT (shown in Fig. 6c). One heterozygous deletion clone for MER11B at chromosome 8 predicted to regulate NUDCD1 was also tested (shown in Fig. 6c). The figures show mean ± SD values for three technical replicates. Source data are provided as a Source Data file.

