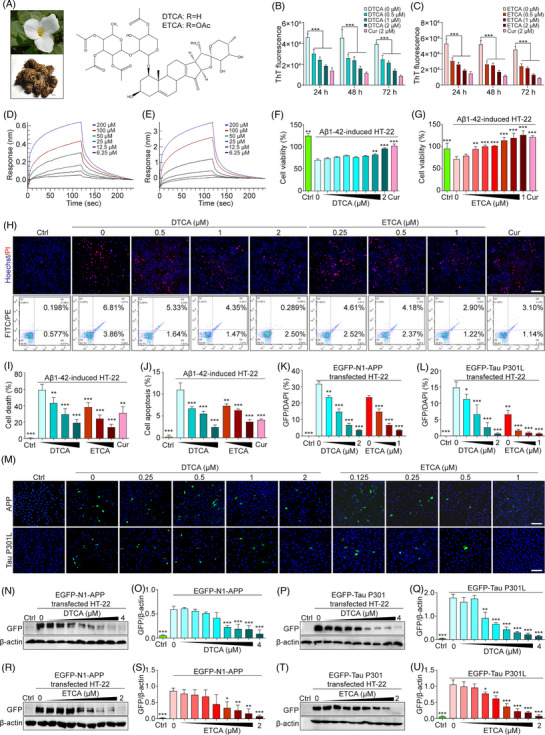
FIGURE 1.

Inhibition of Aβ1‐42 fibrillization, cytotoxicity and AD‐related protein expression by deoxytrillenoside CA and epitrillenoside CA (DTCA&ETCA). (A) Aerial part and rhizome of TTM and chemical structures of DTCA&ETCA. (B and C) Bar charts showing the fluorescence intensity of solutions containing ThT reagent and Aβ1‐42 with or without DTCA, ETCA, and Curcumin (Cur) at specified concentrations; error bars, ***p < .001, n = 3. (D and E) Kinetic analysis of DTCA and ETCA binding affinity to Aβ1‐42 using BLI assay. The response (nm) represents the optical thickness of the sensor layer, reflecting the spectral shift (Δλ) during the interaction of DTCA (6.25–200 μM) or ETCA (6.25–200 μM) with Aβ1‐42. (J and K) Bar charts indicating the cell viability of HT‐22 cells treated Aβ1‐42, with or without DTCA and ETCA at specified concentrations, using Cur (10 μM) as a positive control; error bars, standard deviation (S.D.), *p < .05; **p < .01; ***p < .001, n = 3. (H) Representative images of Hoechst/PI staining and flow cytometry images of Aβ1‐42‐treated HT‐22 cells with or without DTCA and ETCA at specified concentrations, using Cur (10 μM) as a positive control. (I and J) Bar charts indicating the cell death and cell apoptosis of HT‐22 cells; error bars, S.D., **p < .01; ***p < .001, n = 3. (K and L) Bar charts showing GFP/DAPI ratios in HT‐22 and PC‐12 cells; error bars, S.D., *p < .05; **p < .01; ***p < .001, n = 3. (M) Representative images of merged GFP and DAPI in HT‐22 cells overexpressing EGFP‐N1‐APP or EGFP‐Tau P301L and stained with DAPI, treated with DTCA and ETCA at specified concentrations. Magnification: 20× , scale bar: 100 μm. (N, R) Representative Western blot images of GFP and β‐actin in HT‐22 cells overexpressing EGFP‐N1‐APP and treated with DTCA and ETCA at specified concentrations. (O, S) The relative protein expression of APP is indicated by the ratio of GFP‐tagged APP to β‐actin using a GFP antibody, represented as GFP/β‐actin. Bar charts indicating GFP/β‐actin ratios in HT‐22 cells; error bars, S.D., *p < .05; **p < .01; ***p < .001, n = 3. The original Western blot images are presented in Figure S19, where the protein molecular weight markers were labelled. (P, T) Representative Western blot images of GFP and β‐actin in HT‐22 cells overexpressing EGFP‐Tau P301L and treated with DTCA and ETCA at specified concentrations. (Q, U) The relative protein expression of Tau P301L is indicated by the ratio of GFP‐tagged Tau P301L to β‐actin using a GFP antibody, represented as GFP/β‐actin. Bar charts displaying GFP/β‐actin ratios in HT‐22 cells; error bars, S.D., *p < .05; **p < .01; ***p < .001, n = 3. The original Western blot images are presented in Figure S19, where the protein molecular weight markers were labelled.
