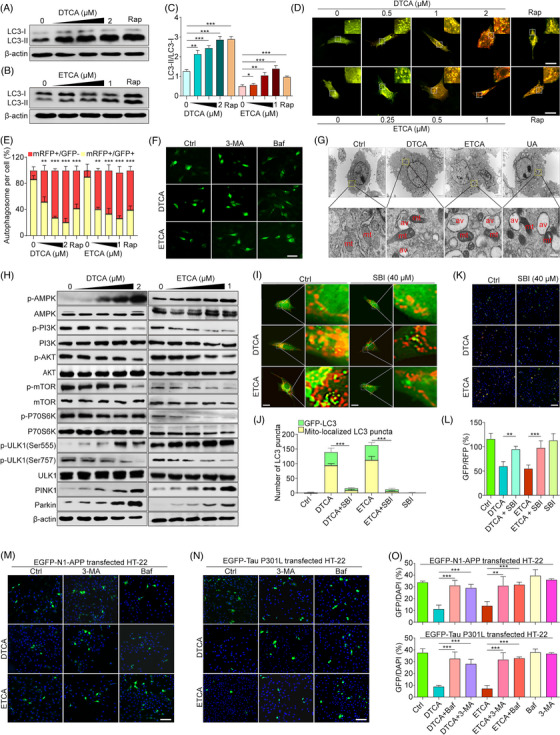
FIGURE 2.

Activation of mitophagy by deoxytrillenoside CA and epitrillenoside CA (DTCA&ETCA) through mTOR, AMPK/ULK1 and PINK1/Parkin signaling pathways, and promotion of autophagic degradation of AD‐related proteins. (A and B) Western blot images of LC3 and β‐actin in HT‐22 cells treated with DTCA, ETCA and Rapamycin (Rap) at specified concentrations for 24 h. The original Western blot images are presented in Figure S21, where the protein molecular weight markers were labelled. (C) Bar chart indicating LC3‐II/LC3‐I ratios; error bars, S.D., *p < .05; **p < .01; ***p < .001, n = 3. (D) Merged images of GFP‐LC3 and RFP‐LC3 in tf‐LC3‐overexpressing HT‐22 cells treated with DTCA, ETCA and Rap at specified concentrations. Magnification: 63× , zoom in, scale bar: 5 μm. (E) Bar chart indicating the percentage of autophagosome per cell in tf‐LC3‐overexpressing HT‐22 cells treated with DTCA, ETCA and Rap at specified concentrations; error bars, S.D., **p < .01; ***p < .001, n = 3. (F) Representative images of GFP‐LC3 puncta in HT‐22 cells treated with DTCA (.5 μM) and ETCA (.25 μM) with or without 3‐MA (5 mM) and Baf (5 nM). Magnification: 40× , scale bar: 25 μm. (G) Electron micrographs of HT‐22 cells treated with or without DTCA (.25 μM), ETCA (.5 μM), and UA (50 μM) for 24 h, showing ultrastructural details. Top: Magnification: 10,000 × , scale bar: 2 μm; Bottom: Magnification: 250 000× , scale bar: 500 nm. Autophagic vacuoles (av) and mitochondria (mt) are indicated. (H) Western blotting of phosphorylated AMPK (p‐AMPK), AMPK, p‐PI3K, PI3K, p‐Akt, Akt, p‐P70S6K, P70S6K, p‐mTOR, mTOR, p‐ULK1(Ser555), p‐ULK1(Ser757), ULK1, PINK1, Parkin and β‐actin in HT‐22 cells exposed to DTCA and ETCA at specified concentrations for 24 h. The original Western blot images are presented in Figure S22, where the protein molecular weight markers were labelled. (I) Merged images displaying GFP‐LC3 puncta and mitochondria in GFP‐LC3‐expressing HT‐22 cells, alongside Mito‐Tracker Red CMXRos‐stained mitochondria. The cells were treated with DTCA and ETCA with or without SBI for 24 h. The image on the right, featuring enhanced detail, corresponds to the zoomed‐in region delineated by the white dashed line. Magnification: 40×, scale bar: 10 μm. (J) Quantification of GFP‐LC3 puncta (green) and Mito‐localized LC3 puncta (yellow); bars, S.D., ***p < .001, n = 3. (K) Merged images of GFP and RFP in Mito‐QC‐expressing HT‐22 cells exposed to DTCA and ETCA with or without SBI for 24 h; magnification: 10× , scale bar: 100 μm. (L) Quantification of GFP/RFP in Mito‐QC‐expressing HT‐22 cells; bars, S.D., **p < .01; ***p < .001, n = 3. (M and N) Representative images of EGFP‐N1‐APP‐ or EGFP‐Tau P301L‐expressing HT‐22 cells treated with DTCA (0.5 μM) and ETCA (0.25 μM) with or without 3‐MA (5 mM) and Baf (5 nM) for 24 h. Magnification: 20× , scale bar: 100 μm. (O) Bar charts showing GFP/DAPI ratios in EGFP‐N1‐APP‐ or EGFP‐Tau P301L‐expressing HT‐22 cells; error bars, S.D., **p < .01; ***p < .001, n = 3.
