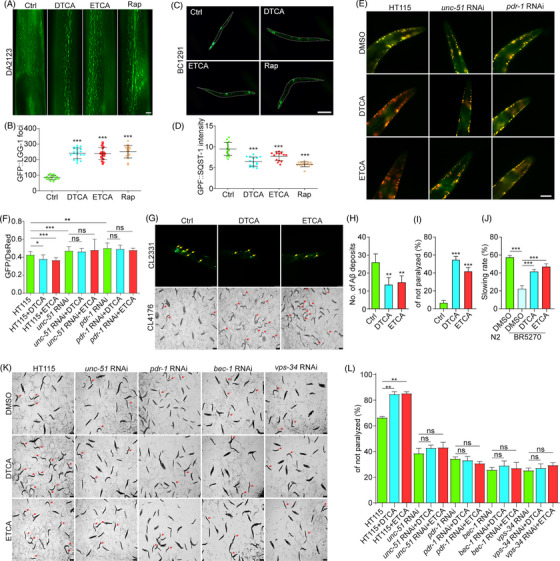
FIGURE 3.

Deoxytrillenoside CA and epitrillenoside CA (DTCA&ETCA) alleviate pathology and behaviour deficits in Caenorhabditis elegans models of AD through mitophagy induction. (A) Representative images of GFP::LGG‐1 foci in DA2123 worms treated with or without DTCA, ETCA and Rap for 48 h. Magnification: 40× , scale bar: 25 μm. (B) Bar chart showing the number of GFP::LGG‐1 foci; error bars, S.D., ***p < .001, n = 20. (C) Representative images of SQST1‐GFP expression in BC12921 worms treated with or without DTCA, ETCA and Rap for 48 h. Magnification: 10× , scale bar: 100 μm. (D) Bar chart displaying relative expression of SQST‐1‐GFP; error bars, S.D., ***p < .001, n = 20. (E) Representative images of merged pH‐sensitive GFP and pH‐insensitive DsRed in IR1631 worms fed with HT115, unc‐51 RNAi and pdr‐1 RNAi bacteria in the presence or absence of DTCA&ETCA. Magnification: 40× , scale bar: 25 μm. (F) Bar chart showing the GFP/DsRed ratio in IR1631 worms; error bars, S.D., *p < .05; **p < .01; ***p < .001, n = 20. (G) Representative images of Aβ3−42 deposits in CL2331 worms at 72 h and paralysis in CL4176 worms at 36 h post‐treatment with DTCA&ETCA. CL2331 worms: Magnification: 40× , scale bar: 25 μm; CL4176 worms: Magnification: 4× , scale bar: 250 μm. (H) Bar chart indicating the number of Aβ3‐42 deposits in the anterior area; error bars, S.D., **p < 0.01, n = 20. (I) Bar chart showing the percentage of non‐paralyzed worms (n > 60); error bars, S.D., ***p < .001, n = 3. (J) Bar chart displaying the slowing rate of N2 and BR5270 worms treated with or without DTCA&ETCA at the 72‐h time point; error bars, S.D., ***p < .001, n = 10. Aβ3‐42 deposits are indicated by yellow arrows; non‐paralyzed worms are indicated by red arrows. (K) Representative images of paralysis in CL4176 worms fed with HT115, unc‐51 RNAi, pdr‐1 RNAi, bec‐1 RNAi and vps‐34 RNAi bacteria in the presence or absence of DTCA&ETCA for 36 h. Magnification: 4× , scale bar: 250 μm. Non‐paralyzed worms are indicated by red arrows. (L) Bar chart showing the percentage of non‐paralyzed worms (n > 60); error bars, S.D., ***p < .001, n = 3. Results were pooled from three independent experiments.
