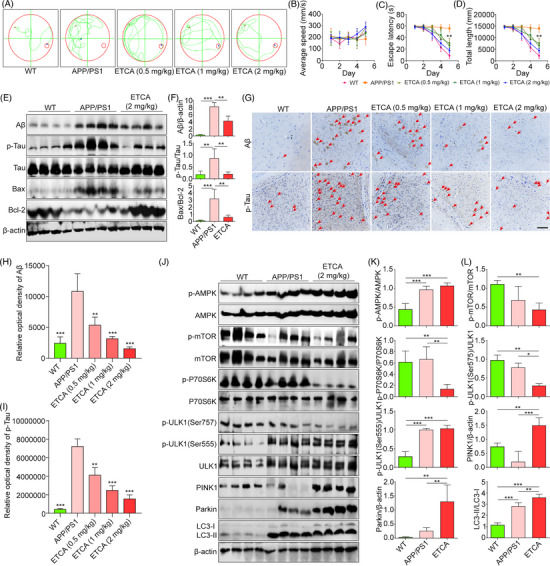
FIGURE 4.

Epitrillenoside CA (ETCA) mitigates cognitive impairment and AD‐associated pathology in APP/PS1 mice via mitophagy induction. (A) Computer‐generated superimposed swimming trajectories of wide‐type and APP/PS1 mice treated with or without ETCA. (B–D) Average swimming speed, escape latency and total swimming length of wide‐type and APP/PS1 mice treated with or without ETCA; error bars, S.D., **p < .01, n = 8. (E) Western blotting of Aβ, p‐Tau, Tau, Bax, Bcl‐2 and β‐actin in hippocampal tissue of wide‐type and APP/SP1 mice. (F) Bar charts showing Aβ/β‐actin, p‐Tau/Tau and Bax/Bcl‐2 ratios; error bars, S.D., **p < .01, ***p < .001, n = 4. The original Western blot images are presented in Figure S27, where the protein molecular weight markers were labelled. (G) Representative immunohistochemistry images of Aβ and p‐Tau in hippocampal sections of wide‐type and APP/PS1 mice. Magnification: 10×, scale bar: 100 μm. Red arrows denote the presence of Aβ and p‐Tau. (H and I) Bar charts indicating the relative optical density of Aβ and p‐Tau; error bars, S.D., **p < .01; ***p < .001, n = 3. (J) Western blotting of p‐AMPK, AMPK, p‐P70S6K, P70S6K, p‐mTOR, mTOR, p‐ULK1(Ser555), p‐ULK1(Ser757), ULK1, PINK1, Parkin, LC3 and β‐actin. (K and L) Bar charts indicating p‐AMPK/AMPK, p‐P70S6K/P70S6K, p‐mTOR/mTOR, p‐ULK1(Ser757)/ULK1, p‐ULK1(Ser555)/ULK1, PINK1/β‐actin, Parkin/β‐actin and LC3‐II/LC3‐I ratios; error bars, S.D., *p < .05, **p < .01, ***p < .001, n = 4. The original Western blot images are presented in Figure S28, where the protein molecular weight markers were labelled.
