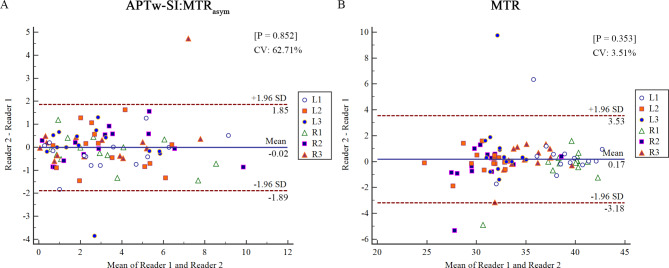
Fig. 5.
Bland–Altman plots for the repeatability of APTw-SI (A) and MTR (B) measurements. Plots include the 95% limits of agreement (LOA), mean absolute difference and coefficient of variation (CV). Most dots were located within the 95% LOA. Only 2 points (2/84, 2.4%) in (A) and only 4 points (4/84, 4.8%) in (B) exceed the 95% LOA range for APTw-SI and MTR measurements, respectively. Blue line = mean absolute difference, red dotted lines = 95% confidence interval of the mean difference (LOA). R1 = right longus capitis, R2 = right tensor veli palatini, R3 = right medial pterygoid, L1 = left longus capitis, L2 = left tensor veli palatini, L3 = left medial pterygoid

