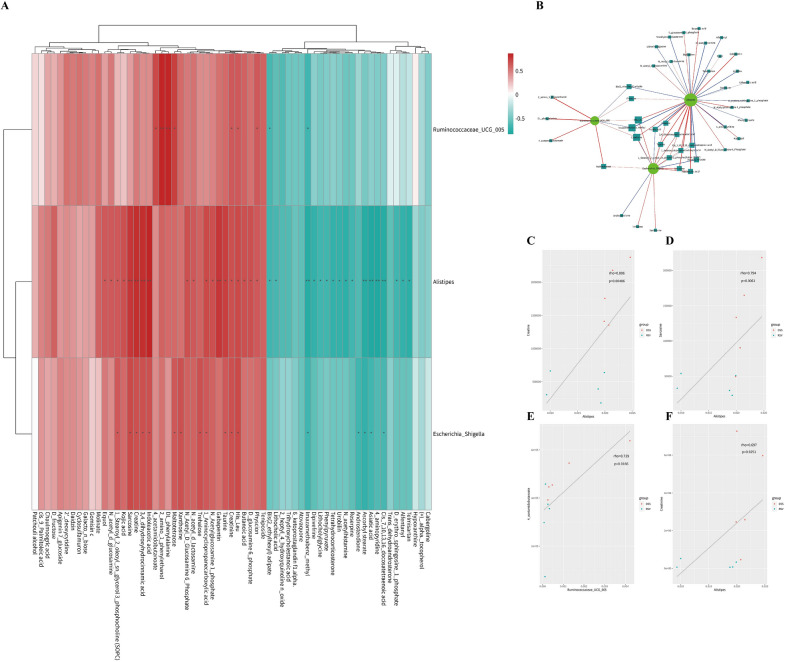
Fig. 6.
Resveratrol modulates the microbiota-arginine/proline metabolic axis. A Spearman correlation analysis of hierarchical clustering heatmap of significant difference microbiota and significant difference metabolites betweenthe RSV and DSS groups. P-value reflects the significant level of correlation and was defined by P < 0.05 as *, P < 0.01 as **, P < 0.001 as ***. B Spearman correlation analysis network of significant difference flora and metabolites between the RSV and DSS groups. In the correlation network diagram, the color of the line represents the positive and negative value of the correlation coefficient between the two (blue represents negative correlation and red represents positive correlation), and the thickness of the line is directly proportional to the absolute value of the correlation coefficient. The node size is positively correlated with its degree, that is, the greater the degree, the larger the node size; C–F Representative scatter diagram of correlation (Creatine, Sarcosine,4-acetamidobutanoate, Creatinine)

