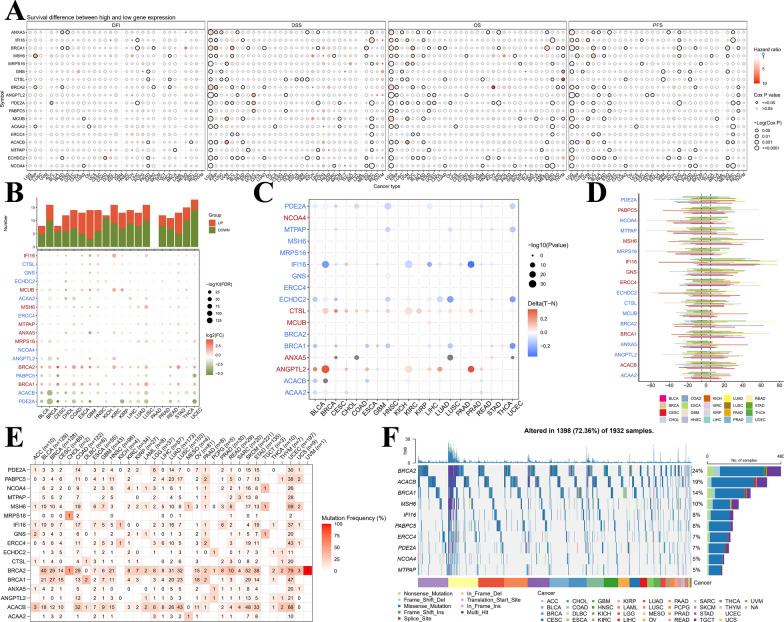
Fig. 11.
The landscape of mtPCDI signature genes in pan-cancer analysis. A Presents hazard ratios and Cox P values for selected cancer types and genomic symbols. Rows represent genomic symbols, while columns denote cancer types. The color and size of the bubbles indicate hazard ratios and significance of Cox P values, respectively. A blue to red color gradient is used to represent low to high hazard ratios, and larger bubbles correspond to greater statistical significance of Cox P values. The black outline border highlights the Cox P value ≤ 0.05 threshold. In B, graphs exhibit logFC and FDR of signature genes for each cancer type. Red and blue colors indicate clearly up- and down-regulated genes, respectively. Additionally, C shows a heatmap demonstrating varied methylation patterns of signature genes in malignant tumors. Hypermethylated and hypomethylated genes are represented in red and blue, respectively, employing Wilcoxon rank-sum test the degree of statistical significance assessed. D is a bar graph that presents frequency of copy number variation changes for each signature gene and cancer type. Finally, E and F demonstrate signature gene mutation frequency and single-nucleotide variant oncoplot for a given malignancy, respectively

