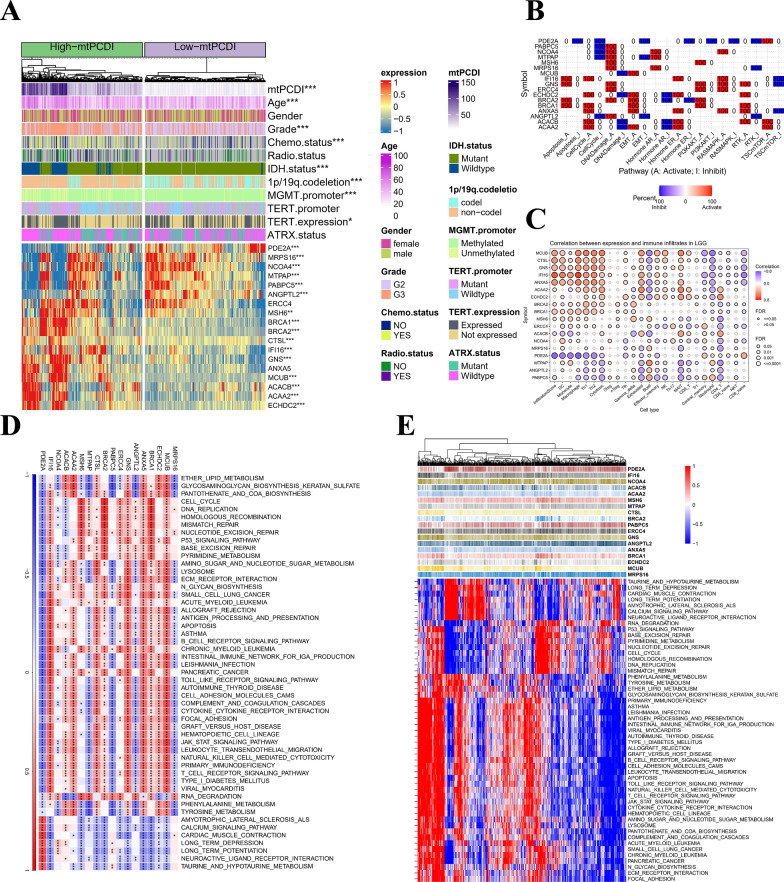
Fig. 3.
Annotation of characteristics for the mtPCDI signature genes. A Heatmap is presented to display the relationship of mtPCDI groups and clinical features, as well as the expression of the 18 most significant genes in patients with LGG. B Heatmap displays the proportion of cancers in LGG in which a gene exhibits a significant impact (with FDR ≤ 0.05) on the pathway, with each cell representing the corresponding percentage value. C Bubble plot that presents the summary of the correlation between18 mtPCDI signature genes expression and 24 immune cell types infiltrates in LGG. D Heat map showing the gene-pathways involved in 18 mtPCDI signature genes. E Heatmap displaying the enrichment scores of important pathways. *p < 0.05; **p < 0.01; ***p < 0.001; ns, no statistical significance

