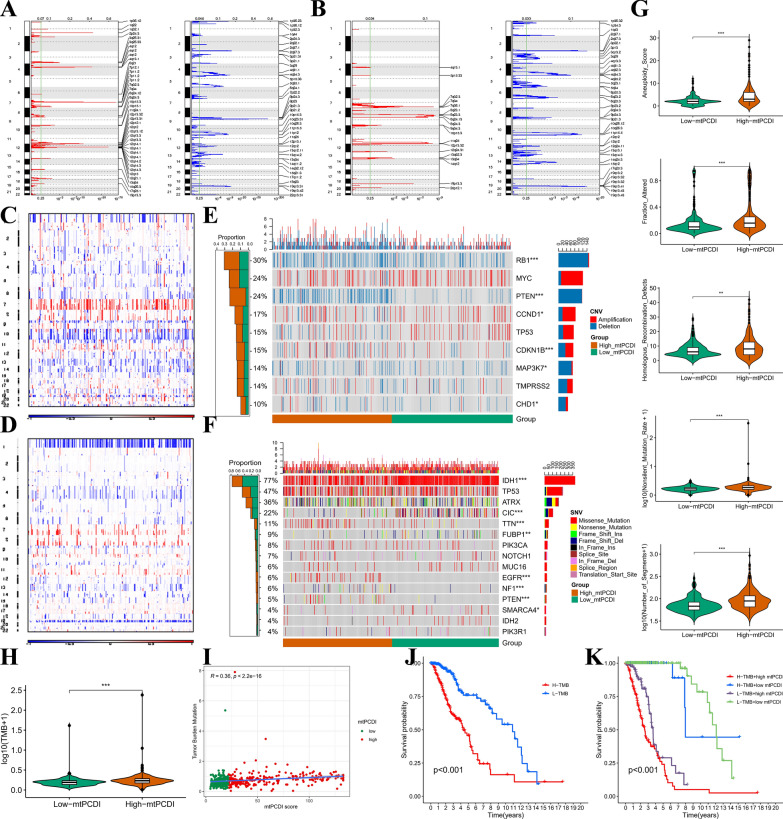
Fig. 4.
Multi-omics characterisation. Recurrent regions of copy number amplification and deletion in the (A) mtPCDI-high and (B) low-mtPCDI. Different profiles of copy number alterations observed between LGG patients with high- and low-mtPCDI. C–D, landscape with 1p/19q co deletion incidence in high and low mtPCDI subset. E Oncoprint showing genes affected by recurrent copy number alterations, with corresponding proportions of alterations in each group depicted in the bar plot on the right. F Oncoprint showing common somatic gene mutations, with corresponding proportions of mutations in each group depicted in the bar plot on the right. G Comparison of aneuploidy score, fraction altered, homologous recombination defects, nonsilent mutation rate, and number of segments between high- and low-mtPCDI patients in the TCGA-LGG dataset. H Comparison of high- and low-mtPCDI subgroups of TMB. I Mutation load and mtPCDI correlation analysis. J Kaplan–Meier curve of OS for patients classified by mtPCDI. K mtPCDI and TMB-categorized OS Kaplan–Meier curves. *p < 0.05; **p < 0.01; ***p < 0.001; ns, no statistical significance

