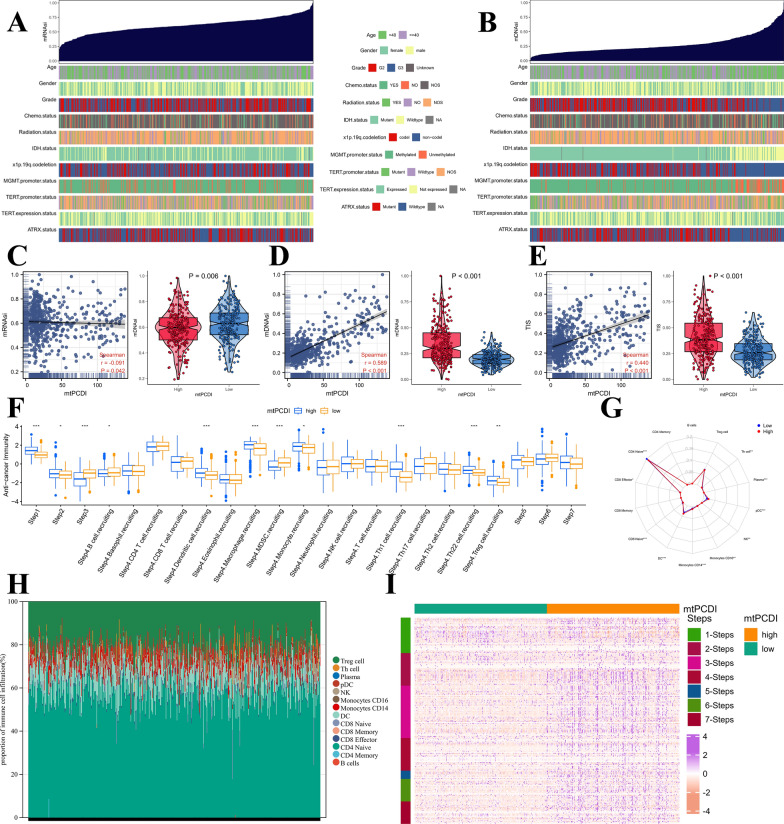
Fig. 6.
Functional annotation of the mtPCDI signature. A Association between known clinical and molecular features (age, gender, grade, chemotherapy status, radiotherapy status, IDH1 status, MGMT promoter methylation status, 1p/19q codeletion, TERT promoter methylation status, TERT expression status, and ATRT status) and mRNAsi in LGG. B Association between known clinical and molecular features (age, gender, grade, chemotherapy status, radiotherapy status, IDH1 status, MGMT promoter methylation status, 1p/19q codeletion, TERT promoter methylation status, TERT expression status, and ATRT status) and mDNAsi in LGG. C Correlation between mRNAsi and mtPCDI, and mRNAsi difference between two mtPCDI groups. D Correlation between mDNAsi and mtPCDI, and mDNAsi difference between two mtPCDI groups. E Correlation between TIS and mtPCDI, and TIS difference between high- and low-mtPCDI groups. F Box plot portrays the dissimilarities in cancer immunity cycle between two mtPCDI groups. G Radar plot displaying the tumor-infiltrating immunecells between two mtPCDI groups. H The bar plot shows the relative proportion of tumor-infiltrating immunecells. I Heatmap illustrates the expression levels of 178 step-specific signature genes associated with anti-cancer immunity across all samples in the seven-step Cancer-Immunity Cycle. *p < 0.05; **p < 0.01; ***p < 0.001; ns, no statistical significance

