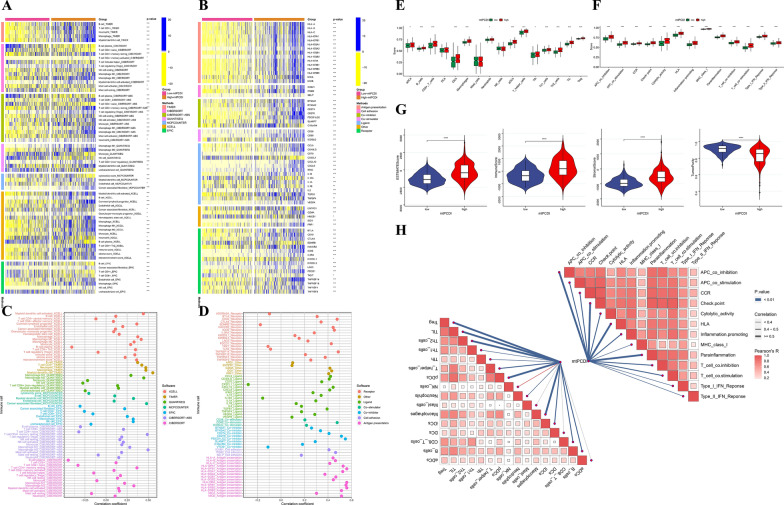
Fig. 7.
Exploration of the tumour immune microenvironment. A Immune infiltrating cells were estimated by using multiple algorithms between the two mtPCDI subgroups. B Immune modulator molecules were estimated between the two mtPCDI subgroups. C Correlation analysis to estimate the number of immune-infiltrating cells. D Correlation analysis to estimate the presence of immune modulator chemicals. Differences in scores for infiltrating immune cells E and immune-related functions F between two mtPCDI groups. G Estimatescore, immunescore, stromalscore, and Tumorpurity in the two mtPCDI groups. H butterfly plot to illustrate the correlation between mtPCDI and infiltrating immune cells, as well as immune-related functions. *p < 0.05; **p < 0.01; ***p < 0.001; ns, no statistical significance

