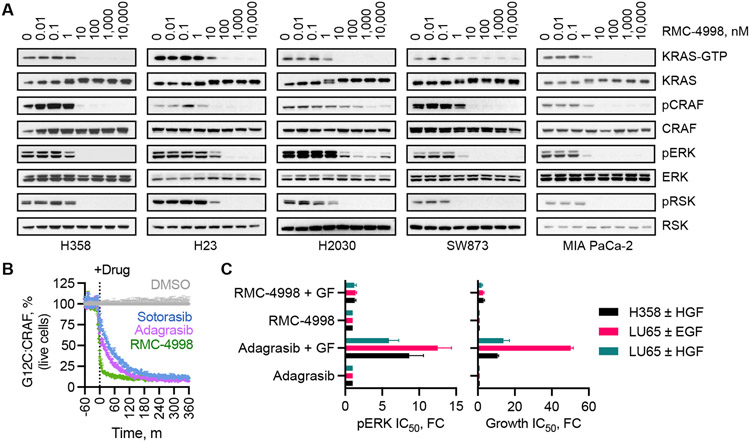
Fig. 3. Cellular effects of active state selective KRASG12C inhibition.
(A) Extracts from the indicated KRASG12C mutant cell lines were treated with RMC-4998 for 2 h before lysis and immunoblotting. The levels of active KRAS (KRAS-GTP) were determined by pull-down with the RAS-binding domain (RBD) of CRAF. A representative of at least two independent experiments for each cell line is shown. (B) The kinetics of target inhibition in live cells treated with an active state (RMC-4998, 100 nM) or an inactive state (sotorasib, 10 μM and adagrasib, 1 μM) selective inhibitor were determined as in Fig. 2C (mean ± SEM, N=3) (C) The indicated cell lines were treated as shown in the presence or absence of growth factor (GF) stimulation to determine the effect on ERK phosphorylation (pERK/total, 4 h) or cell proliferation (120 h) (mean ± SEM, N=3-4). EGF: epidermal growth factor, HGF: hepatocyte growth factor.

